Regression
Example homework problem:
You work for an automotive magazine, and you are investigating the relationship between a car’s gas mileage (in miles-per-gallon) and the amount of horsepower produced by a car’s engine. You collect the following data:
| Automobile: | 1 | 2 | 3 | 4 | 5 | 6 | 7 | 8 | 9 | 10 |
| Horsepower: | 95 | 135 | 120 | 167 | 210 | 146 | 245 | 110 | 160 | 130 |
| MPG: | 37 | 19 | 26 | 20 | 24 | 30 | 15 | 32 | 23 | 33 |
Compute the best-fitting regression line (Y’ = a + bx) for predicting a car’s gas mileage from its horsepower. Test to see if the slope of this regression line deviates significantly from zero (alpha = .05).
If you would like some help with the hand-written solution to this problem, then click here.
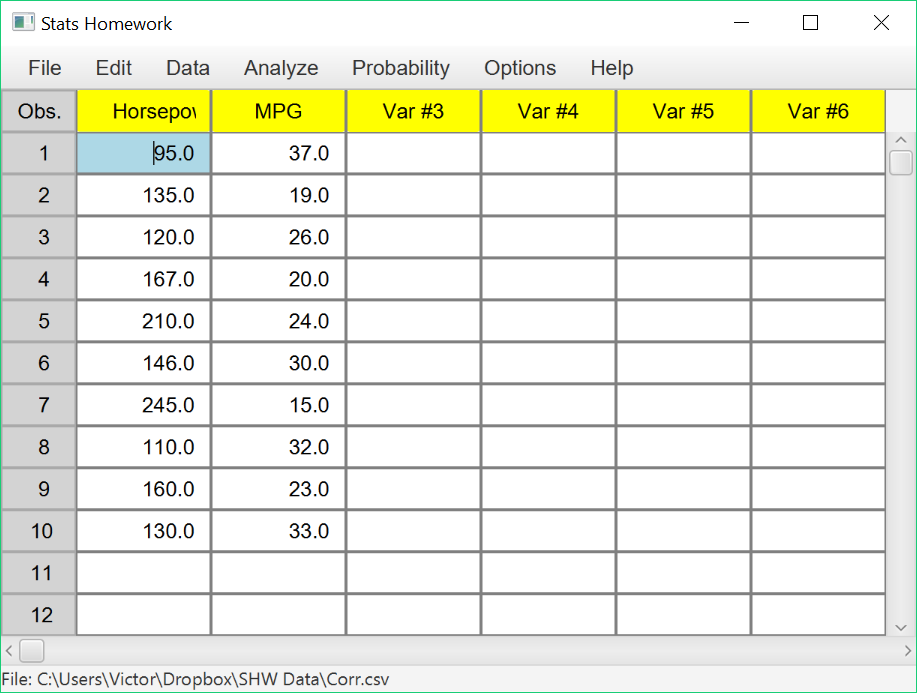
Enter these data into the first two columns of Stats Homework’s data manager and rename the variables. Your screen should look like this:
Make sure to double-check and save your data. To conduct your analysis, pull down the Analyze menu, choose Tests of Relationship, and then choose Linear Regression. You will be presented with this dialog:
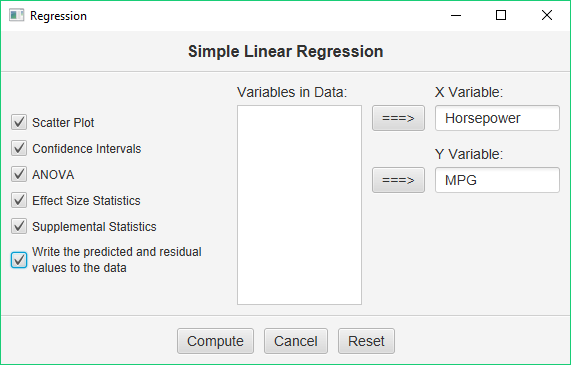
Select Horsepower as your X (predictor) variable, and then MPG as your Y (outcome) variable. Then, check all the output options and click Compute.
Basic Output
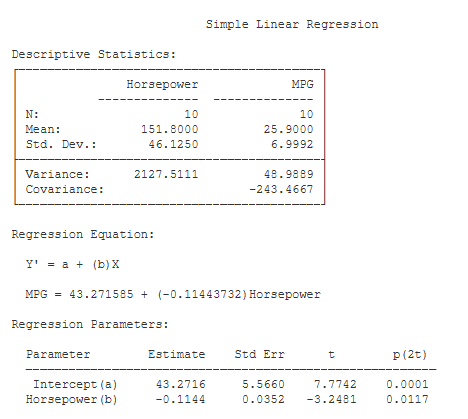
Descriptive Statistics. Basic descriptive statistics are covered on the page for the explore procedure and the correlation procedure.
Regression Equation. Here, you will see a formal statement of your regression equation: Y’ = a + bx. As noted here, you will see that each predicted value of Y, and each error in prediction (residual) has been written back into your data set.
Regression Parameters.These statistics will help you understand whether or not your regression parameters –a and b– deviate significantly from zero.
- Estimates: Y Int. (a) (43.27): this is the Y intercept (a) from the regression equation. Slope (b) (-.1144): this is the slope (b) of the regression equation.
- Std Err: (5.57, .035): these ares the standard errors of the intercept and slope. t (7.77, -3.25): these are the values of the t test statistics for the intercept and the slope. They are equal to the parameters divided by their respective standard errors.
- p (2-tail) (.00, .012): these are the significance levels of the t tests.
Optional Output

Confidence Intervals for the Slope (b). You are given the 95% and 99% confidence intervals for the population slope, based on your sample b. The 95% confidence interval tells you that, with 95% certainty, you would estimate the population slope to be between -.20 and -.03.
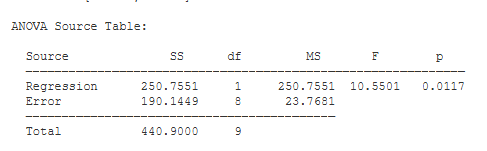
ANOVA Source Table. You have two sources of variance: variance accounted for in Y by the regression line, and variance not accounted for by the regression line (Error). Each variance component is associated with its own sum of squares (SS), degrees of freedom (df), and mean square (MS).
F is equal to MS(Regression) / MS(Error) (10.55). Note that F will be exactly equal to t². Next to the F statistic is p — the chance probability / significance level of your result (.012). Also note that the p value for the F test will be exactly equal to the p value for the t test.
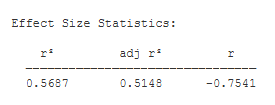
Effect Size Statistics. These statistics describe the magnitude of the relationship between your predictor and outcome variables:
- r² (.57): this is the Coefficient of Determination. r² represents the proportion of variance in the two variables that is shared — i.e., the proportion of variance in gas milage (Y) that can be accounted for by horsepower (X).
- adj r² (.51): this is the Adjusted Coefficient of Determination. It represents an unbiased estimate of the variance accounted for (i.e., it controls for sample size).
- r (-0.75): This is equal to the Correlation Coefficient.

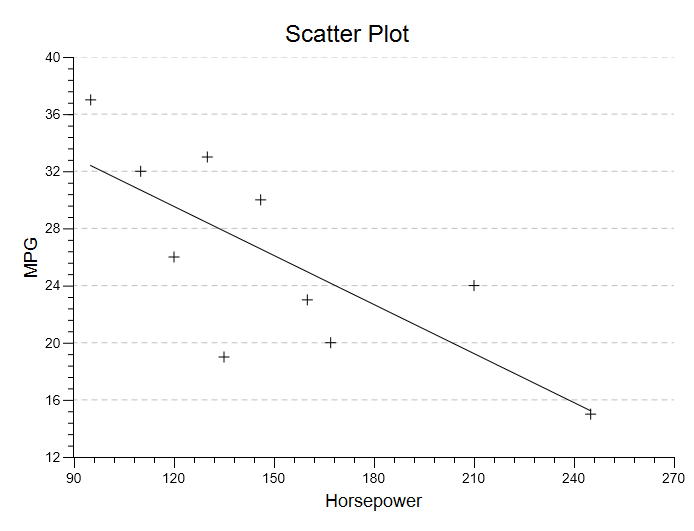
Scatter Plot. You will be presented with a basic scatter plot of your data. Above, I added the regression line to the plot.
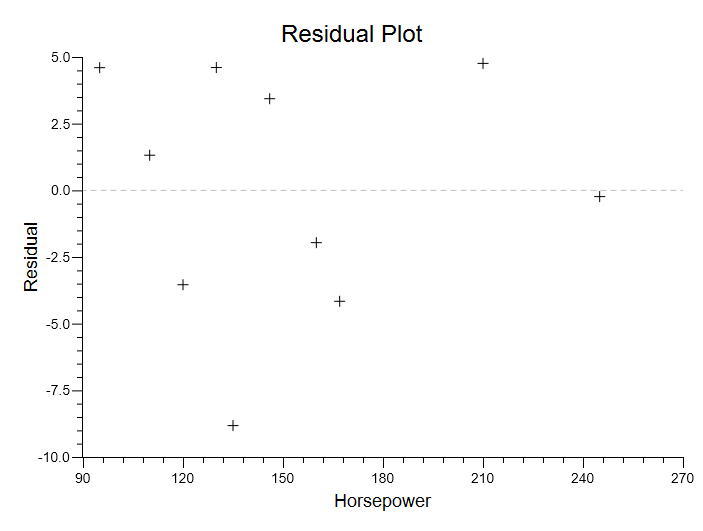
One of the assumptions of the regression analysis is that your residuals will be randomly distributed relative to X. You can use the options to display a residual plot, which will help you to visually assess the validity of this assumption: