Example homework problem:
Twenty participants were given a list of 20 words to process. The 20 participants were randomly assigned to one of two treatment conditions. Half were instructed to count the number of vowels in each word (shallow processing). Half were instructed to judge whether the object described by each word would be useful if one were stranded on a desert island (deep processing). After a brief distractor task, all subjects were given a surprise free recall task. The number of words correctly recalled was recorded for each subject. Here are the data:
| Shallow Processing: | 13 | 12 | 11 | 9 | 11 | 13 | 14 | 14 | 14 | 15 |
| Deep Processing: | 12 | 15 | 14 | 14 | 13 | 12 | 15 | 14 | 16 | 17 |
Did the instructions given to the participants significantly affect their level of recall (alpha = .05)?
The above problem involves an experiment with two treatment conditions. The goal of your test is to see if there is significant mean difference between the two treatment groups.
We will test for a significant mean difference between the treatment groups with a t-test for independent samples:
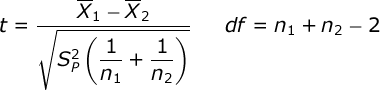
The numerator of this formula represents the mean difference between the two treatment groups. The denominator represents the standard error of the mean difference. Within the denominator, you will see that we will compute the pooled variance of our two treatment groups:
![]()
Pooled variance is a weighted average of the variance estimates from our two groups. If you need any help computing the mean and variance for each of your groups, look at the documentation for the explore procedure. n refers to the sample size for each of our groups.
Compute test statistic. Compute the mean and variance for each group. You will find that:
| Treatment Group: | Shallow | Deep |
| Mean: | 12.600 | 14.200 |
| Variance: | 3.378 | 2.622 |
| n: | 10 | 10 |
Next, compute the pooled variance:
![]()
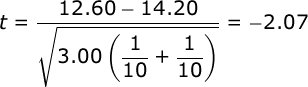
Finally, compute the value of the t statistic:
Conduct hypothesis test. Our t test will have df equal to the total of our sample sizes minus 2. In our case, we have 10 participants in each group, so we would have df = n1 + n2 – 2 = 10 + 10 – 2 = 18.
Alpha was set at .05 and we will conduct a two- tailed test. When you consult your table of critical values for t, you will find that if our obtained value of t is greater than 2.101, then we would conclude that the mean difference in recall between our two treatment conditions is significant.
Since the obtained t (-2.07) is not greater in absolute value than the critical t (2.101), we would conclude that there is not a significant difference in recall between the two treatment groups.
Effect size. To describe the effect size for this study, we will first compute r²:
![]()
r² is an estimate of the proportion of variance in our dependent variable that can be accounted for by our manipulation of the independent variable. So, we could conclude that 19% of the variance in recall was due to our manipulation of the encoding instructions.
However, many researchers prefer to use an unbiased effect size estimate — one that takes into account the fact that we are doing small sample research. So, we will also compute Omega Squared:
![]()
We would conclude that our manipulation of encoding instructions accounted for 14% of the variance in memory performance.
Finally, we will compute Cohen’s D:
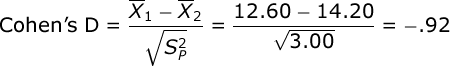
Cohen’s D standardizes the mean difference in terms of standard deviation units. It is equal to the mean difference divided by the square root of the pooled variance. In our case, we would conclude that there is a .92 standard deviation difference between our treatment group means.
Confidence intervals. We will find the 95% confidence interval for the mean difference. You compute the limits of your CI with this formula:
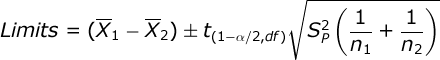
Compute the standard error for the t test (0.7746), multiply this by the critical value for your t test (2.101), and then add this to and subtract this from the mean difference between your groups (-1.60):
![]()
We can say with 95% certainty that the population mean difference between our treatment groups is between -3.23 and +0.03. Note that the
value 0.00 is within our 95% confidence interval for the mean difference. We would conclude from this that the mean difference between our groups in our experiment was not statistically significant.
If you would like a 99% confidence interval, just change the critical value of t in the formula.