In a number of research designs you will be working with independent / unrelated samples of data. A good example of this is a completely-randomized experimental design. Let’s suppose that you have 12 participants in your experiment, and you have randomly assigned 6 to Treatment Group #1 and 6 to Treatment Group #2. Each treatment group participates under a different treatment condition, and you collect some relevant dependent variable from each participant. Let’s say that these are your data:
Group #1 Scores:  1,  2,  3,   4,  5,   6
Group #2 Scores:  7,  8,  9,  10, 11,  12
You will be submitting these data to a test of mean difference between two independent groups such as a T test, or a Mann-Whitney U test. The question is, how should you enter these data into the data manager to conduct this sort of analysis?
Indicator Variable Approach
In most professional packages like SPSS, you have to use a grouping or indicator variable — a variable that will tell us which score in our data is from which group. We will call this the “Indicator Variable Approach” to managing our data from independent samples. In Stats Homework, we would enter data like this:
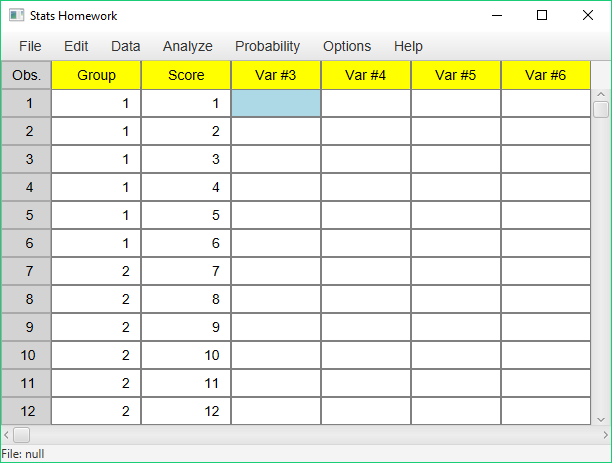
Make sure to rename your variables! The guiding philosophy here is that all the data from one observation or participant is entered into one line — one line per observation. In SPSS, you have to use a numeric indicator variable — e.g., “1” and “2.” In Stats Homework, you can use a numeric or non-numeric indicator variable — as long as this variable has two and only two values. So you can use much more descriptive values — “Delayed” and “Immediate.”
If you request a T test for independent samples in Stats Homework, you will work with a user dialog that looks like this:
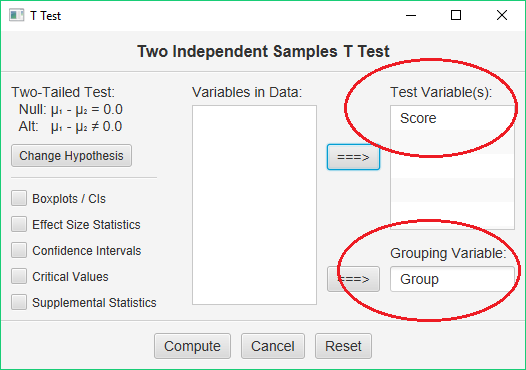
You will move the grouping or indicator variable to the blank labeled, “Grouping Variable,” and move the variable with your scores to the blank labeled, “Test Variable.” The values you use for your indicator variable will be used in the output for your analysis. So it’s often best to use descriptive non-numeric values for this variable.
Separate Variables Approach
In Stats Homework, it is also acceptable to enter the data from two independent samples as two separate variables:
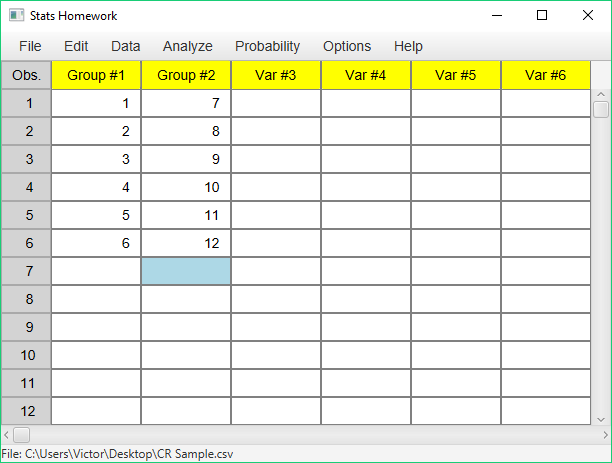
Here, the guiding principle is simplicity — you enter only your data from the study, and you do not have to create a new variable. In addition, the data layout is visually simple — you can easily see which scores are in which group.
When you request the T test for independent samples, you will see the same dialog as before:
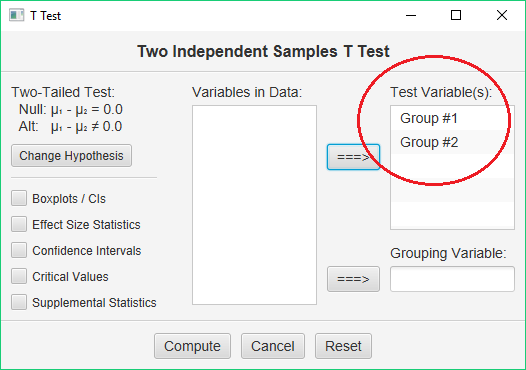
However, this time you will not use an indicator/grouping variable. You simply move both of your variables to the “Test Variables” box. The names of your variables will be used in the output, so make sure you use descriptive variable names.
You will have the choice of using either of these approaches to data management when conducting any test of independent samples. These include the T test, the one-factor ANOVA, the two-factor ANOVA, and the non-parametric and permutation tests that apply to the same designs.
So, which approach should you use? If you wish to be prepared for the transition to using professional statistical software systems, you should definitely use the indicator variable approach. If you are working with simple data sets and analyses, and you want to “keep it simple,” feel free to use the separate variables approach.