The Plot Grab procedure is a utility program that will allow you to easily import data from an existing graphical plot. It will extract the data values from a plot and insert these data into Stats Homework’s data manager for you to manage and analyze.
To get started, select Plot Grab under the Miss menu. Here is the user dialog:

Start by clicking the first button, 1. Get File, and use the file dialog to open a graphical file containing a plot. This file can be in .png or .jpg format. You can also simply drag your plot file to the open area on this dialog.
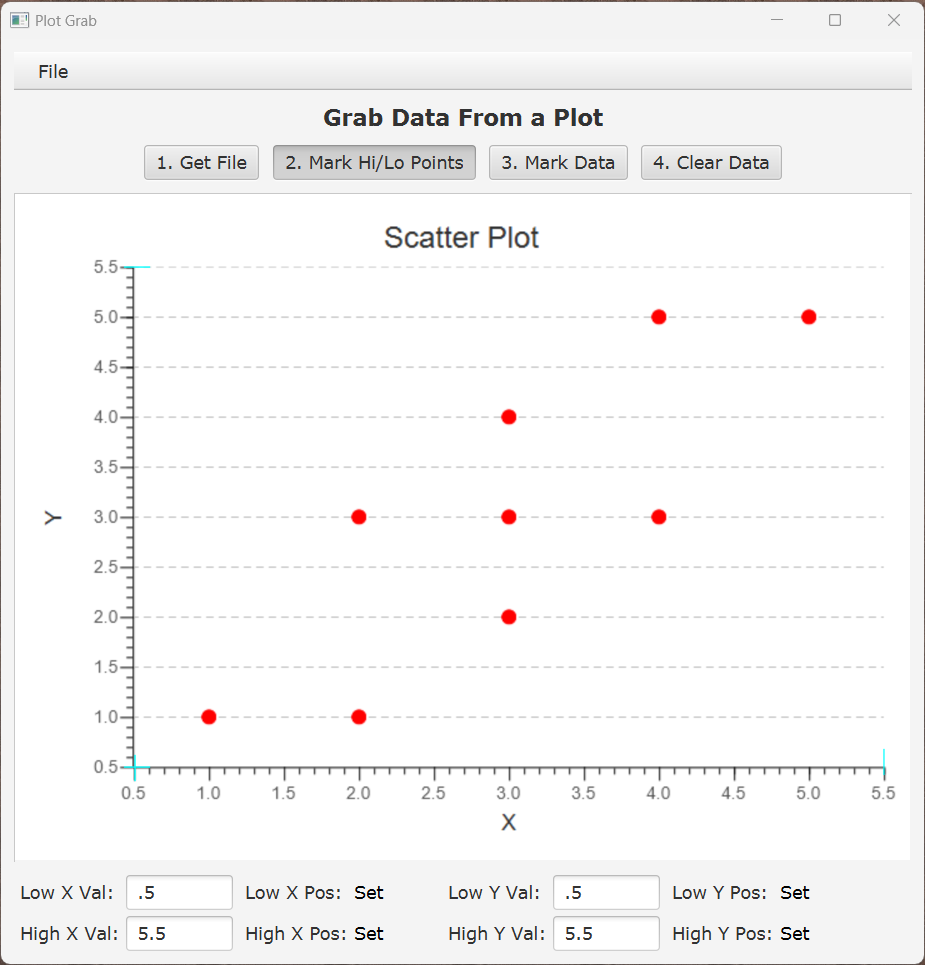
Here, I’ve opened a .png file containing a simple scatterplot:

You must educate the program on the nature of this plot’s X and Y axes. The program needs to know the low and high values of each axis, and it needs to know where these points are located in the graph you have opened.
Start by entering four numerical values in the four blanks at the bottom of the dialog. The X axis ranges from .5 to 5.5, so enter .5 as the low X value, and 5.5 as the high X value. The Y axis also ranges from .5 to 5.5, so enter these values for the low and high Y values.
Now, click the second button, 2. Mark Hi/Lo Points. You need to show the program about where the high and low points of the X and Y axes are on this graph. You will see that the program is flashing the “Low X Pos: Not Set” field. Carefully place the “+” cursor directly over the line above the .5 value on the X axis and click. Now, do the same for the 5.5 value on the X axis. Each time you mark a location, the program leaves behind a small blue marker. Make sure that these markers are lined up with the low and high points of the X axis.
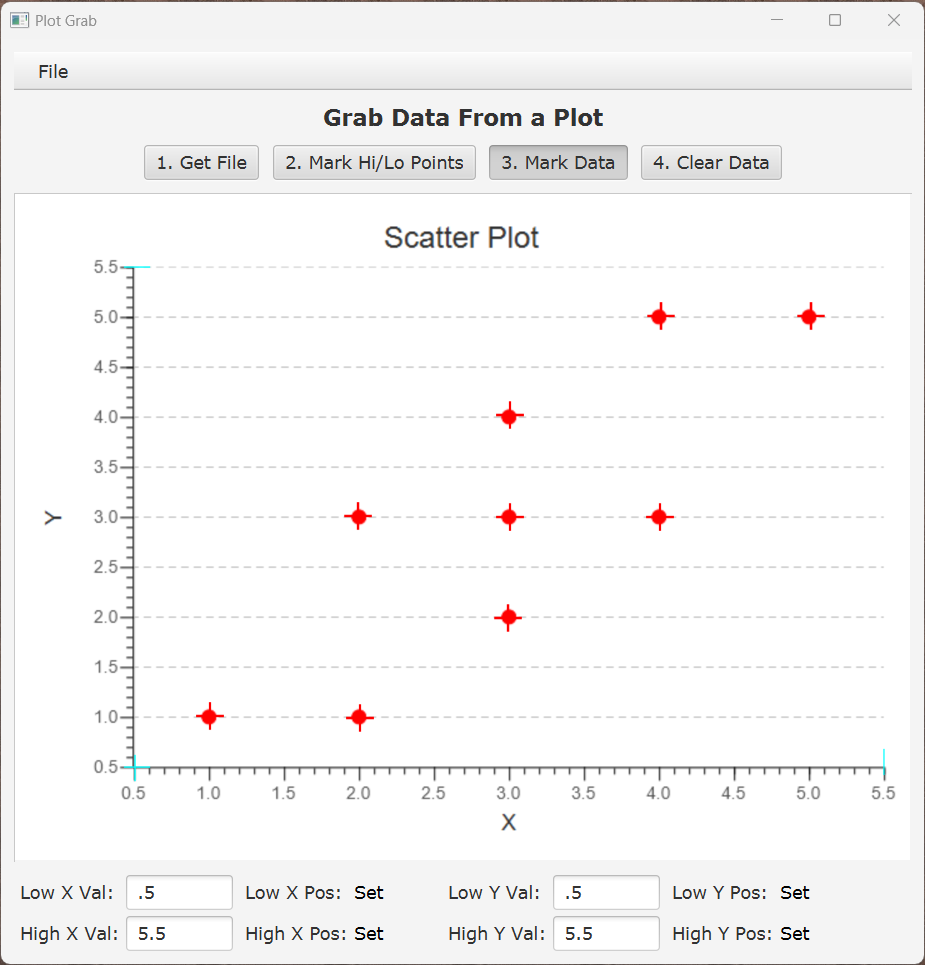
Repeat this process for the Y axis – mark the low and high points along the Y axis. When finished, all four fields should no longer be blinking, and they should say “set” instead of “not set” like you see in this image:
Review the dialog carefully. Make sure that you have correctly entered the minimum and maximum values for each axis, and that you have indicated the location of the low and high points for each axis on the graphical image. This is the information that the program needs to extract the values of the data correctly.
Ok, you are finally ready to grab some data from this plot. Click the next button, 3. Mark Data. Then, carefully place the “+” curser over each of the data points and click. As you are marking each data point, you will see that you leave behind a red “+” marking each data point:
You will also see each observation appear in the data manager window to the right:
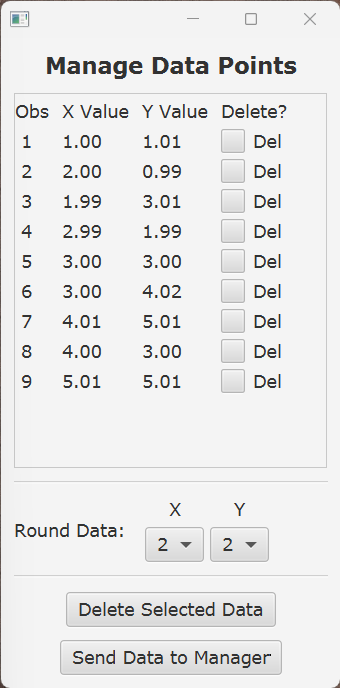
If you make any errors while marking the data, you can delete these observations by clicking the “Del” checkbox on these observations in the data manager and then click the Delete Selected Data button at the bottom. If you would like to start over, just click the 4. Clear Data button.
Notice that you can adjust the rounding of your data. If you look at the data in this example, it’s quite clear that the data are simply whole numbers: 1, 2, 3, 4, and 5, and that the reason for values like .99 and 2.99 is that we didn’t perfectly place the cursor on the data points. So, I would choose to round both X and Y values to have 0 decimal places:
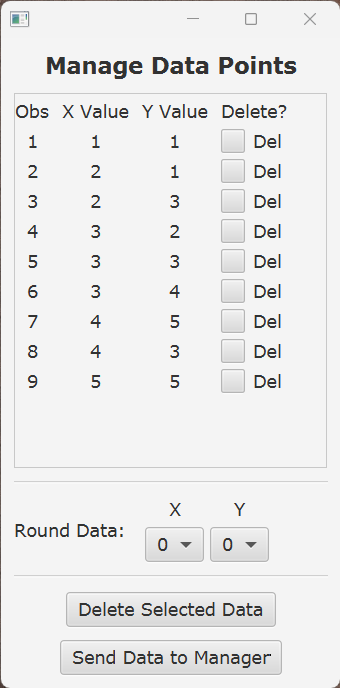
Finally, click the button, Send Data to Manager. When you return to the data manager in Stats Homework, you will find these data waiting for you to manage, save, and analyze.