Stats Homework has a utility program built in to help you work with a variety of different probability distributions. To access this sub-program, pull down the Probability menu, and choose Statistical Probabilities, Critical Values, and Power. You will see this dialog:
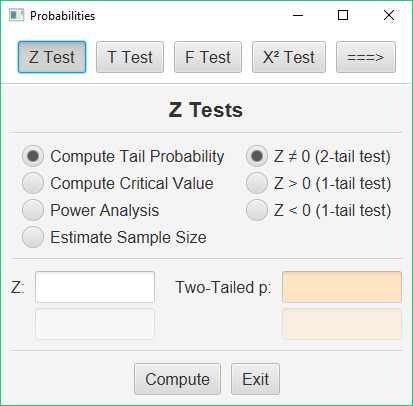
This sub-program replaces all the statistical tables that you have at the back of your textbook. It will compute the critical values of your test statistics or the exact chance probabilities of your test statistics, and it can compute statistical power and estimate required sample sizes. It has routines for most of the common statistical distributions (e.g, Z, T, F, Chi-Square).
Compute Critical Values of Test Statistics
To illustrate the use of these procedures, we will focus on one statistical problem involving the F statistic. This example utilizes the situation and data portrayed in the help pages for the one-factor ANOVA.
Let us suppose that you have computed an F statistic with 3 and 20 df. You do not have a statistical table for the F statistic with you, and you would like to know what would be the critical value for this statistical test.
Click the F Test button, and then click the “Compute Critical Value” option. The dialog will change to this:
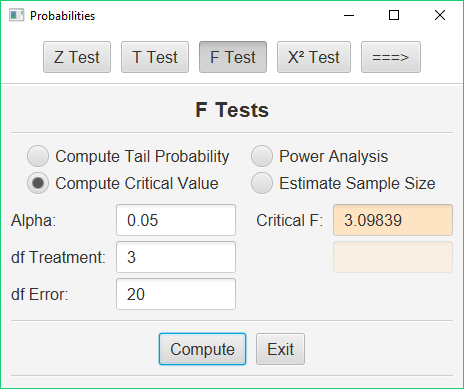
Enter 3 as your df Treatment, and 20 as your df Error. If you would like alpha to be some value other than .05, then change this value. Press the Compute button and this utility program will return the critical value of F. In our case, we would compare our obtained value of F to 3.098.
Compute Significance Levels of Test Statistics
Let us say that you have completed an ANOVA, and you would like to know the chance probability / significance level of your obtained value of the F statistic. Your obtained F was 7.8226, with 3 and 20 df.
Click the “Tail Probability” option. Here is the dialog:
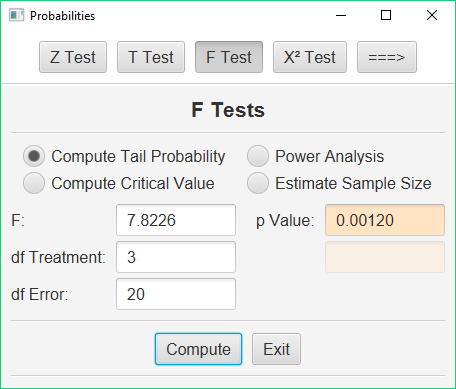
Enter 7.8226 as your F, 3 as your df Treatment, and 20 as your df Error. Press the Compute button, and this utility program will return the chance probability / significance level of F: .001.
Compute a Statistical Power Analysis
The study in our example resulted in an effect size (Omega Squared) of .4603. Our study involved 4 treatment conditions and 6 observations in each treatment condition. We would like to know the statistical power of our result. Click the “Power Analysis” option. Here is the dialog:
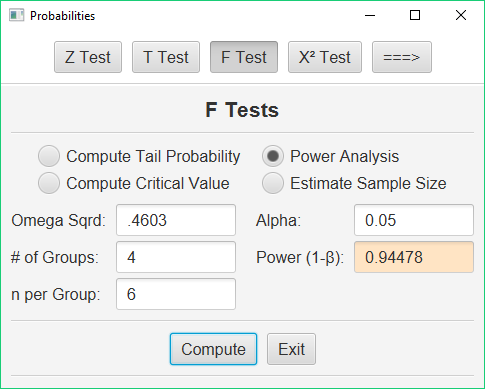
Enter .4603 next to Omega Squared, 4 for the # of groups, and 6 for the # in each group. Leave the options on “Power Analysis” and “Omega Squared.” If you are using a level of alpha other than .05, change this value. When you press the Compute button, this utility program will return the the statistical power of your result (1 – β = .94).
Note that this utility program will also help you to plan future research. Click the “Estimate Sample Size” option. If you will supply the estimated effect size and the desired level of power, it will return an estimate of the required sample size for your study.