Example homework problem:
Twenty participants were given a list of 20 words to process. The 20 participants were randomly assigned to one of two treatment conditions. Half were instructed to count the number of vowels in each word (shallow processing). Half were instructed to judge whether the object described by each word would be useful if one were stranded on a desert island (deep processing). After a brief distractor task, all subjects were given a surprise free recall task. The number of words correctly recalled was recorded for each subject. Here are the data:
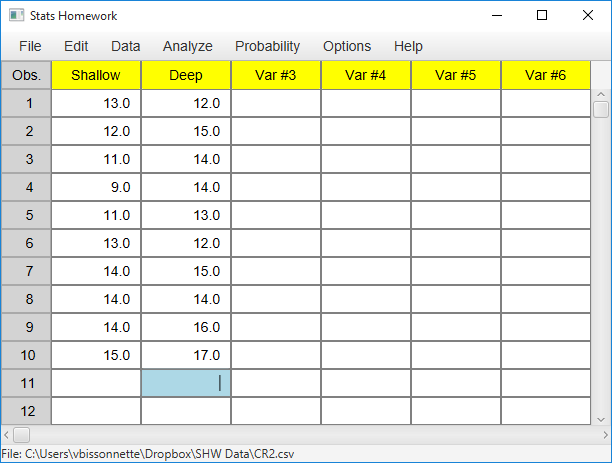
| Shallow Processing: | 13 | 12 | 11 | 9 | 11 | 13 | 14 | 14 | 14 | 15 |
| Deep Processing: | 12 | 15 | 14 | 14 | 13 | 12 | 15 | 14 | 16 | 17 |
Did the instructions given to the participants significantly affect their level of recall (alpha = .05)?
Note that these are the same data that we worked with when you were working with the independent t test procedure. This will allow you to compare and contrast the results of the two procedures.
Enter these data into the first two columns of Stats Homework’s data manager and rename the variables. Your screen should look like this:
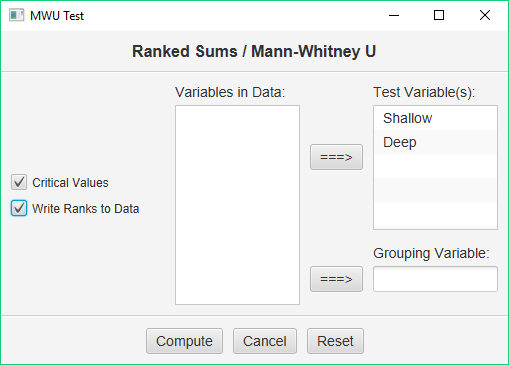
Make sure to double-check and save your data. To conduct your analysis, pull down the Analyze menu, choose Non-Parametric Tests, and then choose Wilcoxon W / Mann-Whitney U.
Before we look at the output produced by this procedure, let’s take a look at the variables that have been created by it and written back into your data:
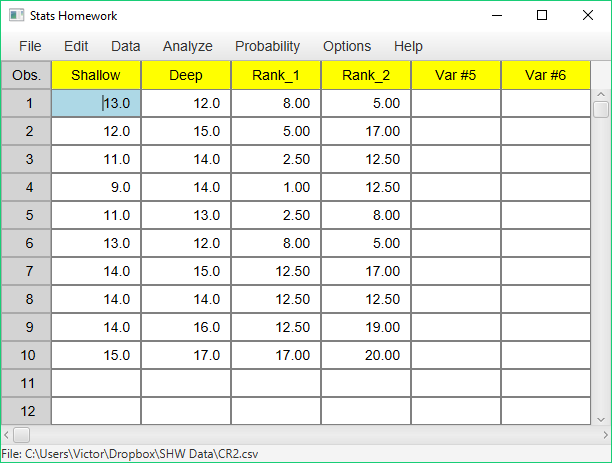
Note that Stats Homework has ranked all of your scores from 1 to 20. Then, it produced two variables: the ranks for your first group/variable (Rank_1), and the ranks for your second group/variable (Rank_2). Both the Wilcoxon W test and the Mann-Whitney U test are computed from the sums of these ranks.
Basic Output
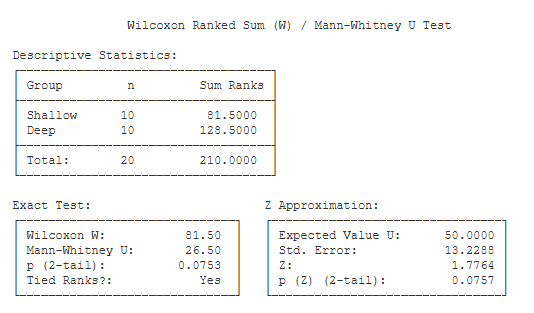
Descriptive Statistics. This table includes the number of scores
for each group, and the sum of the ranks for each group.
Exact Test. This table includes the non-parametric test statistics and
an exact test of their significance level.
- Wilcoxon W (81.50): Compare the sum of the ranks for each group. The Wilcoxon W statistic is equal to the smaller of the two sums.
- Mann-Whitney U (26.50): The Mann-Whitney U statistic is computed from the sum of the ranks.
- exact p (2-tail) (.08): This is an exact significance level of the test statistics if you are conducting a two-tailed / non-directional test.
- exact p (1-tail) (.04): This is an exact significance level of the test statistics if you are conducting a one-tailed / directional test.
Z Approximation. This table presents the normal-approximation approach to estimating the significance level of the Wilcoxon / Mann-Whitney test.
- Expected Value of U (50): If you are computing the Z approximation, this is the expected value of U under your null hypothesis.
- Std. Error (13.23): This is the standard error of the Z statistic.Z (1.78): This is the value of the Z score for your test.
- p (Z) (2-tail) (.08): This is the significance level of the Z approximation if you are conducing a two-tailed / non-directional test.
- p (Z) (1-tail) (.04): This is the significance level of the Z approximation if you are conducing a one-tailed / directional test.
-
Optional Output
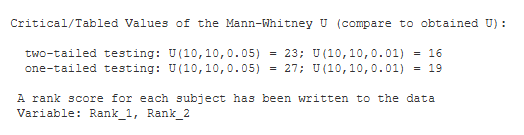
Critical Values. These are the values from a statistical table of critical values for the U test. In our case, we are conducting a two-tailed test with alpha = .05. So, we would compare the value of our obtained U (26.50) to 23. If our obtained U is less than the critical value, then we would conclude that our treatment effect was significant.