Your homework problem:
You are an instructor, and you just gave your 15 students their first exam. You obtained the following scores — each score represents the percentage of exam items answered correctly:
| Exam Score: | 74 | 82 | 89 | 62 | 92 | 48 | 72 | 67 | 68 | 79 | 68 | 71 | 79 | 80 | 69 |
Summarize these data with a variety of descriptive statistics that you are learning in your course. In particular, make sure to compute the mean, the variance, and the standard deviation of these scores.
Measures of Central Tendency:
The median is the score that will divide your data into two halves — it is simply the middle score. So, sort your data from the lowest to the highest score, and find the middle score:
| Exam Score: | 48 | 62 | 67 | 68 | 68 | 69 | 71 | 72 | 74 | 79 | 79 | 80 | 82 | 89 | 92 |
So, the median is equal to 72.00.
The mean is computed with this formula:
![]()
Where ΣX is the sum of your scores and n is the sample size — i.e., the number of scores in your sample.
When you wish to compute descriptive statistics with a sample of scores, the first thing that you should do is obtain three basic statistics: a) the sum of your scores (ΣX), b) the sum of squared scores (ΣX²), and c) the sample size (n). In our sample, ΣX = 1100, ΣX² = 82338, and n = 15.
Now, you are ready to compute the sample mean:
![]()
Measures of Variability:
Sample variance is equal to:
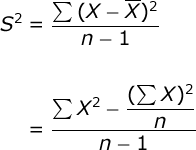
The first formula is a definitional formula for sample variance: sample variance is equal to the sum of the squared deviations between each score and the mean (SS) divided by (n-1).
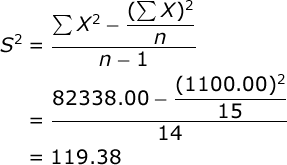
The second formula is a computational formula for sample variance: where ΣX² is the sum of your squared scores (i.e., square each score and sum these values) and (ΣX)² is the sum of your scores that is then squared.
We will use the computational formula to find the sample variance:
The standard deviation of a sample is equal to the square root of the variance. In our case, the sample standard deviation would be:
![]()
Let us continue our analysis by computing the Standard Error of the Mean:
![]()
Standard Error is equal to the standard deviation of your sample divided by the square root of the sample size. This statistic tells you what would be the standard deviation of a distribution of sample means taken from this population where sample size equals n (15).
Another very informative statistic is the Coefficient of Variation:
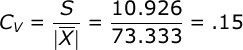
Where the C.V. is equal to the standard deviation of your sample divided by the absolute value of the sample mean (if the mean is not zero, of course). The C.V. standardizes the variability of your sample to a scale that ranges from 0 to 1 (i.e., like a percentage score). Keep in mind that the C.V. can be reliably interpreted when you are working with a ratio scale of measure, but it might not be interpretable when working with an interval scale of measure.
Confidence intervals. We will find the 95% confidence interval for the mean. You compute the limits of your CI with this formula:
![]()
Where t(1 – α/2, df) is the critical value for a t test with df = n – 1 (14) and alpha = .05. In our case, the critical value of the t statistic would be 2.145.
Now, multiply the standard error (2.821) by t (2.145), and then add this to and subtract this from the mean of your sample:
![]()
Thus, we can say with 95% certainty that the population mean is between 67.28 and 79.38.
If you would like a 99% confidence interval, just change the critical value of t in the formula and repeat your calculations.
Return to Descriptive Statistics