So, why would I write another statistical software package?
Every feature of Stats Homework was designed with one goal in mind: to facilitate students’ engagement and learning in basic statistics courses. I believe that using professional statistical packages such as SAS®, SPSS®, or R is undesirable for three reasons:
- Professional packages tend to be expensive and limited in distribution on one’s campus. Even with academic discounts, the professional packages are still relatively expensive for students to purchase. If they cannot purchase their own copy, then students have to do their work in computer labs that often have limited availability.
- Professional packages tend to be difficult for novices to learn. Requiring students to use one of the professional packages in their first statistics course(s) tends to increase the students’ learning load at a time when they are struggling to master the basic statistical concepts being covered in class.
- The outputs from professional packages are typically not very helpful to students who are learning the basic concepts and might be doing problems by hand. Professional packages will give students the answer, but will do little to help them find their errors if their hand-written answer does not match the computer’s. In other cases, the output from professional packages will tend to confuse the student because it is organized differently than the output of their hand-written work.
Stats Homework was specifically designed for students who are learning statistics, so it has these features:
- Stats Homework is free. Any student or instructor who wishes to use this program can download the software free from this web site. Stats Homework has been written in Java — it will run on any modern PC operating system (i.e., Windows, Mac, and Linux/Unix). Thus, every student in the world has access to a powerful and useful statistical software package whenever they need it.
- Stats Homework is extremely easy to use. I suspect that very few students will ever consult the documentation system for this program. Its approach to data management and analysis makes it intuitive and simple to use.
- Stats Homework provides extensive preliminary statistics that students can use to better understand the statistical analysis and to track down their mistakes in case their hand-written answer does not match the one produced by the computer.
Of these features, it is the last one that most distinguishes Stats Homework from the professional statistics packages and makes it more suitable for basic statistics classes. Let me give you a quick example. Let’s suppose that you are conducting a correlational analysis with a very simple data set. If you use SPSS® to compute the Pearson correlation, its default output will look something like this: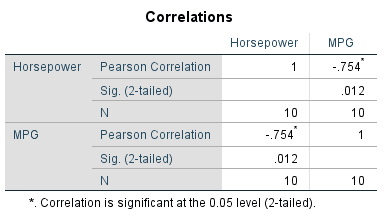 This table includes three statistics: the correlation, the sample size, and the significance level. This output just gives you the final value of r — it does not give you any of the preliminary statistics that are used to compute r, nor does it give you any more information about this analysis that would help you to understand it. Packages like this will do the statistics, but will not really help the student to learn the statistics.
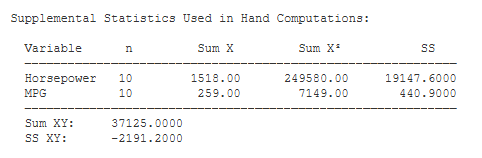
Submit the same data to a correlational analysis in Stats Homework with all the options checked, and you will receive this output: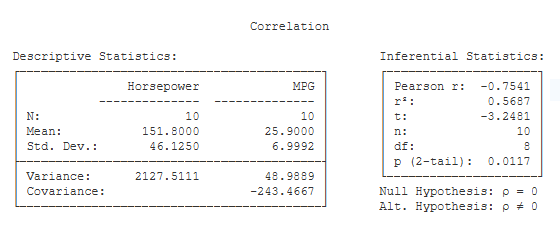
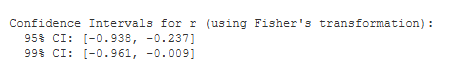
..and this output:
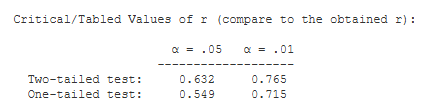
…and this:
…and this:
…and this:
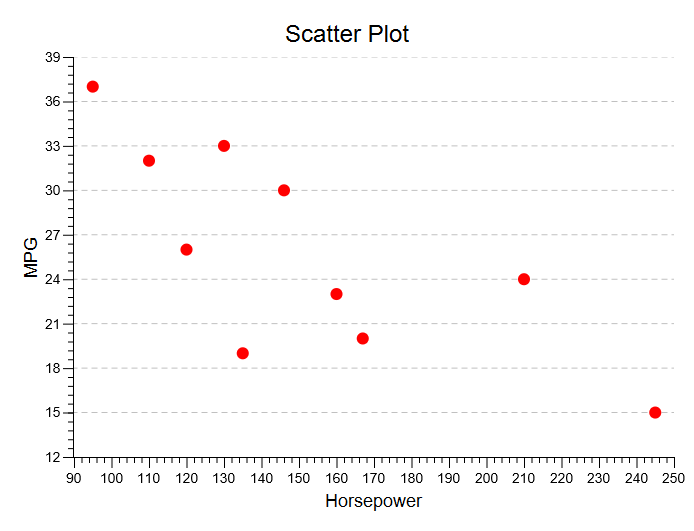 The full output from Stats Homework includes 29 different sample statistics and a scatter plot. In addition to the correlation coefficient and significance levels, the student is provided with a rich assortment of preliminary and supporting statistics. This output can help the student to verify hand-written computations, and reinforces important concepts being learned in class such as one-tailed vs. two-tailed testing, confidence intervals, and the importance of graphically plotting one’s data.
What sorts of tests and procedures are included?
Stats Homework includes all the traditional tests one would expect such as correlation/regression, ANOVA, Chi-Squared, and t tests. In addition, it includes less traditional procedure such as non-parametric tests, permutation tests, reliability analysis, and partial correlation. It includes a broad variety of graphing procedures for creating box plots, stem-and-leaf plots, scatter plots, bar charts, as well as strip charts, mosaic plots, stacked bar charts, and others.
Stats Homework includes powerful tools for simulating data with random sampling and re-sampling. These can be used to illustrate important statistical principles such as the Law of Large Numbers, the Central Limit Theorem, and how permutation tests work. It also includes procedures for illustrating classic distributions such as the normal, t, F, and Chi-Squared distributions. These can help the students to learn important principles such as hypothesis-testing and power analysis.
I believe that Stats Homework includes procedures that would be related to virtually any topic that students and teachers would typically encounter in a basic statistics course. If you ever find an exception to this rule, let me know an I will get busy writing code to improve and expand this software.
Shouldn’t students be expected to learn professional statistical packages?
Certainly — students should learn how to use a professional statistics package such as SPSS® as they move from their early methods and statistics classes to conducting supervised and independent research with their faculty advisers. That is why I designed Stats Homework to be very similar to SPSS in its data manager, and in many of its menus and user dialogs. Using Stats Homework in their early statistics classes will help students learn to use a professional statistics package later. Where features and function in Stats Homework differ from those of a professional packages, these differences result in a highly consistent and simple program that students can easily master in their first statistics class. They can then move on to a big professional statistics package later without much difficulty.
The goal is statistical education.
My intent in writing Stats Homework was not to create a program to do statistics, but to create a program that will help students learn statistics. I sincerely believe that if students will use this program in their first statistics course(s), it will help to reduce their anxiety about statistics and statistical software, and facilitate a deeper engagement of the concepts being covered in their classes. This will inherently contribute to their long-term success.
So, whether you are an educator or a student, I hope that you will try using Stats Homework. And, please feel free to send me feedback about your experience. I would welcome any comments, suggestions, or questions that you might have. I’m always looking for ways to make this program more helpful to you as you learn or teach basic statistics.
If you have any questions or feedback about the use of Stats Homework, please contact Victor Bissonnette at: vbissonnette@berry.edu.