Your homework problem:
You suspect that a gambler’s die is “loaded,” such that its six outcomes are not equally likely. You roll this die 120 times and get the following results:
| Side of Die: | 1 | 2 | 3 | 4 | 5 | 6 |
| Observed Frequency: | 16 | 16 | 10 | 20 | 28 | 30 |
Is this a fair die? In other words, does the obtained pattern of frequencies deviate significantly from what you would expect by chance (i.e., equal probability) (alpha = .05)?
If you would like some help with the hand-written work on this problem, then click here.
In Stats Homework pull down the Analyze menu, choose Analysis of Frequency or Proportion, and then choose Goodness of Fit Test.
Entering Frequency Data
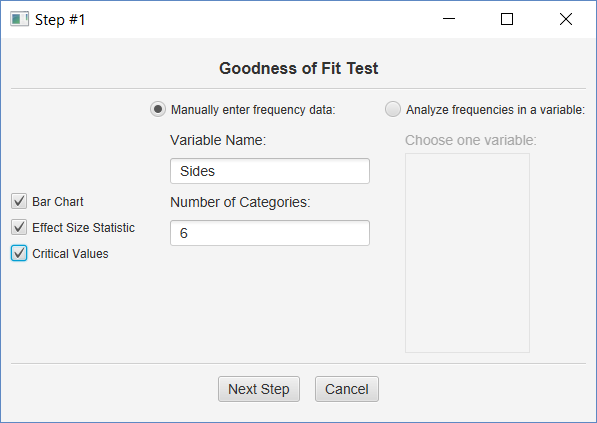
Click ‘Manually enter frequency data,’ enter a name for your variable, and then enter 6 for the number of categories. Click both output options, and then click the Next Step button.
Working with Raw Data
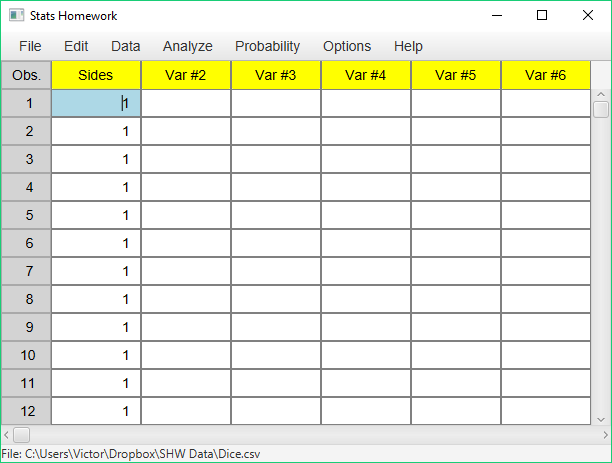
It’s possible that you will work with a data set that contains the raw data for a goodness-of-fit test. In this case, you would have a data set with 120 observations — 16 ones, 16 twos, 10 threes, 20 fours, 28 fives, and 30 sixes. In this case, you would specify this variable in this dialog:
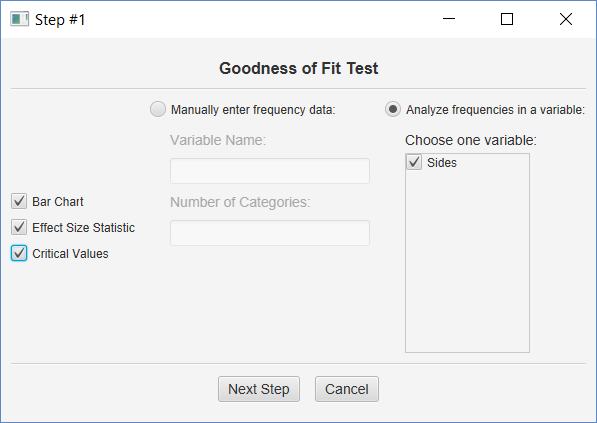
Click ‘Analyze frequencies in a variable,’ and click the variable name. Then click all of the output options and the Next Step button.
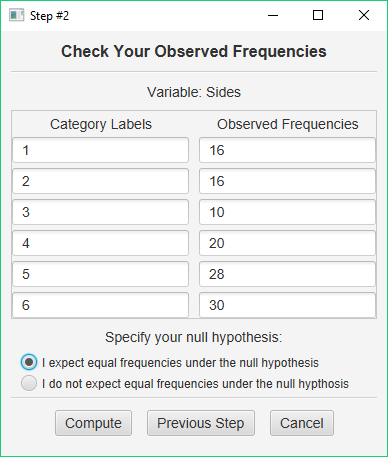
If you are working with raw data, this table will already be filled in for you. If you are entering frequencies manually, then it will be blank. Enter your category labels and your observed frequencies.
Next, specify whether or not you expect equal frequencies under your null hypothesis. If yes, click the first option and then click Compute. If no, click the second option and then click the Next Step button (the Compute button changes into the Next Step button when you choose this option). If you expect unequal frequencies, you will be presented with a third dialog that will ask you to enter these.
Output
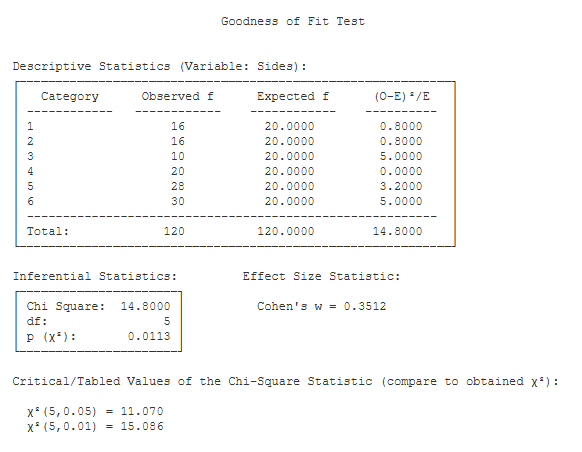
Descriptive Statistics. This table lists the observed and expected frequencies for each outcome category, along with the total observed and expected frequencies (these should match). In addition, this table presents each outcome category’s contribution to the Chi Square statistic, and the total Chi Square statistic.
Inferential Statistics. This table presents the Chi Square statistic (14.80), its df (5), and the p value for the obtained value of Chi Square (.01).
Effect Size Statistic. This output includes the value of Cohen’s W (.35), which is interpreted much like the value of a correlation coefficient.
Critical Values. These are the values from a statistical table of critical values for the Chi Square test. In our case, we are conducting a test with alpha = .05. So, we would compare the value of our obtained Chi Square (14.80) to 11.070.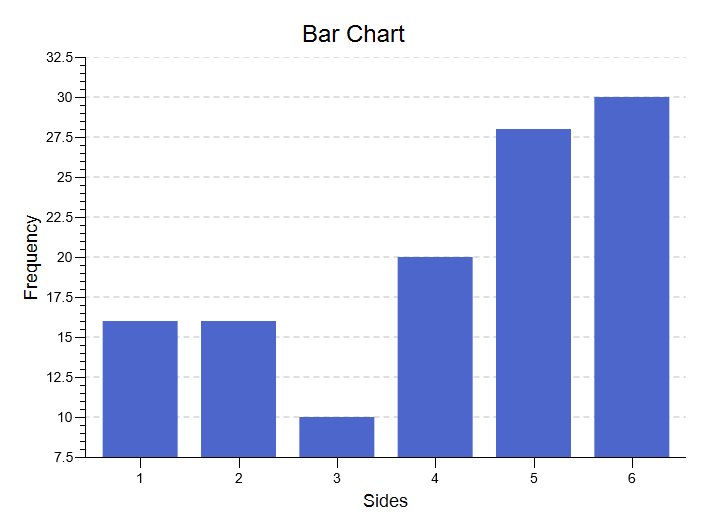 Bar Chart. This chart will illustrate the frequencies that you analyzed with the goodness-of-fit test. It can plot the frequencies or the relative frequencies, and it offers you a number of options for customizing the chart to your needs.