Example Homework Problem:
When polled about a proposition on an upcoming ballot, the responses of men and women were as follows:
| Agree | Undecided | Disagree | |
| Men: | 70 | 25 | 40 |
| Women: | 30 | 20 | 25 |
Do men and women differ in their attitudes towards this issue (alpha = .05)?
You want to know if there is a significant relationship between one’s gender and her or his attitude toward this issue. That’s why this is called a Contingency Table — you want to know if the categorical outcome (columns) is contingent on (i.e., related to) the categorical factor (rows).
We would use the Chi Square statistic to test for a significant contingency between gender and attitude:
![]() where f_o refers to the obtained frequencies in your study and f_e refers to the expected frequencies in your study. r is equal to the number of rows in our table, and c is equal to the number of columns. In our case, r = 2 and c = 3.
where f_o refers to the obtained frequencies in your study and f_e refers to the expected frequencies in your study. r is equal to the number of rows in our table, and c is equal to the number of columns. In our case, r = 2 and c = 3.
The expected frequencies come from a model that assumes that one’s attitude and one’s gender are unrelated. We compute the value of the expected frequency for each cell with this formula:
![]()
So, we need to set up our analysis by first computing the total frequency for each row, and for each column. Then compute the overall total frequency. Finally, compute the expected frequency for each cell in our table. For example, the expected frequency in the first cell would be equal to 100 * 135 / 210 = 64.29.
Your completed table should look like this:
| Agree | Undecided | Disagree | Sum | |
| Men: | 70 (64.29) |
25 (28.93) |
40 (41.79) |
135 |
| Women: | 30 (35.71) |
20 (16.07) |
25 (23.21) |
75 |
| Sum: | 100 | 45 | 65 | 210 |
where the expected frequency for each cell is in parentheses. Computing the Chi Square statistic is simple, but you need to be patient with the number of steps involved:
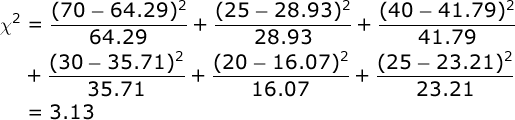
It’s a good idea here to use the memory function in your calculator:
a) clear your calculator’s memory, b) compute the first segment of this
equation and place the result in your memory, and c) compute each other
segment of the equation and add each to your memory. When you are done,
just recall the sum that is in your calculator’s memory (3.13).
Conduct hypothesis test. The df for our Χ² test will be the number of rows minus 1 times the number of columns minus 1; in our case, df = (2-1)(3-1) = 2. Our alpha = .05. From your table of critical values for the Χ² test, you will find that if the obtained value of Χ² is greater than 5.99, we would conclude that attitude is contingent on gender.
Since 3.13 is not greater than 5.99, we would not conclude that attitude was contingent on / related to gender in our sample.
Compute effect size. If your study involves a 2 X 2 contingency table, we would typically use the Phi Coefficient to compute effect size:
![]()
In our case, we analyzed a 2 X 3 contingency table. So, we will use a relative of Phi — Cramer’s V:
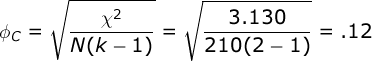
where N equals the total number of observations. In our case, we had 210 participants. k equals either the number of rows, or the number of columns — whichever is less. In our analysis, we will use the number of rows: 2.
Phi and Cramer’s V describe the strength of the contingency in familiar terms — they are much like the Pearson correlation; they range from 0.0 (no relationship to 1.00 (a perfect relationship).