Example homework problem:
Twelve people completed a difficult hand-eye coordination task twice: once in a quiet room, and once in the same room while loud rock-and-roll music was being played. The order in which subjects experienced these conditions was counterbalanced: half performed in the quiet environment first, half performed in the loud environment first. The researcher measured the number of errors committed by the participant while performing. Thus, the lower the score, the better the performance. Here are the results:
| Participant: | 1 | 2 | 3 | 4 | 5 | 6 | 7 | 8 | 9 | 10 | 11 | 12 |
| Quiet Environment: | 14 | 21 | 24 | 16 | 18 | 20 | 15 | 20 | 17 | 16 | 19 | 12 |
| Loud Environment: | 21 | 22 | 21 | 19 | 18 | 25 | 17 | 18 | 21 | 24 | 21 | 15 |
Was there a significant difference in performance between the two treatment conditions (alpha = .05)?
If you would like help with the hand-written solution to this problem, click here.
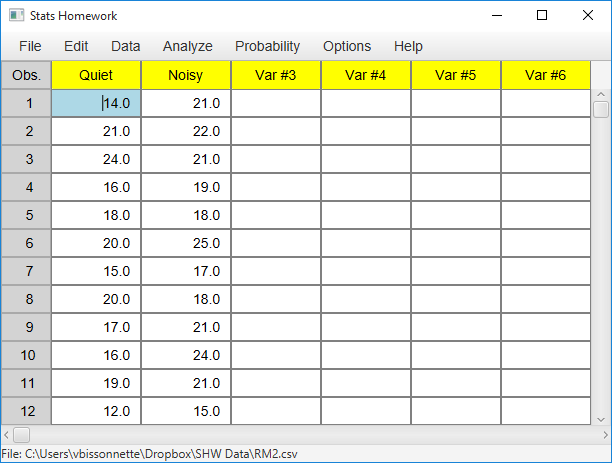
Enter these data into the first two columns of Stats Homework’s data manager and rename the variables. Your screen should look like this:
Make sure to double-check and save your data. To conduct your analysis, pull down the Analyze menu, choose Tests for One or Two Samples, and then choose T Test for Related Samples. Here is the user dialog for this procedure:
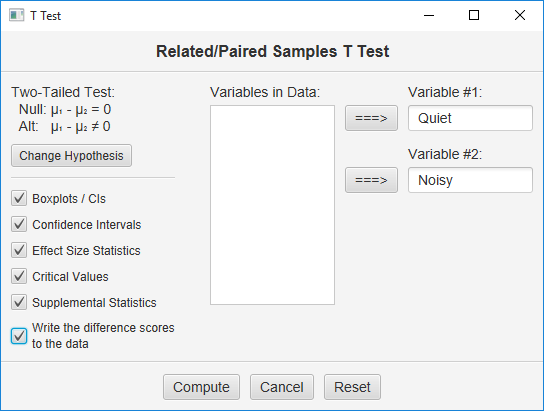
Move the two variables to the two blanks on the right, and then select all your output options. Then, click the Compute button.
Here is the basic output:
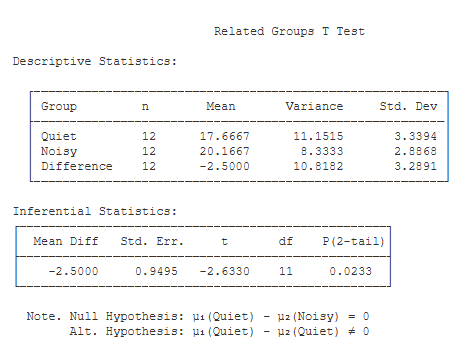
Descriptive Statistics. Basic summary and descriptive statistics are presented for both variables and for the difference scores. Also, these difference scores have been written to your data. For a guide to these statistics, see the documentation page for the explore procedure.
Inferential Statistics. This table lists the results of your t test:
- Mean Diff (-2.50): this is equal to the mean of the difference scores.
- Std. Err. (0.95): this is the Standard Error of the difference scores. This is equal to the standard deviation of the difference scores divided by the square root of n.
- t (-2.63): this is the value of the t test statistic. t is equal to the mean difference score divided by the standard error of the difference scores.
- df (11): this is the df of the t test. df is equal to the number of difference scores minus one.
- p (2-tail) (.02): this is the chance probability / significance level for your t test if you are conducting a two-tailed or non-directional hypothesis test.
Here is the optional output:
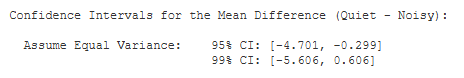
Confidence Intervals. You are given the 95% and 99% confidence intervals for the population mean difference, based on your sample mean difference. The 95%
confidence interval tells you that, with 95% certainty, you would estimate the population mean difference to be between -4.59 and -0.41.
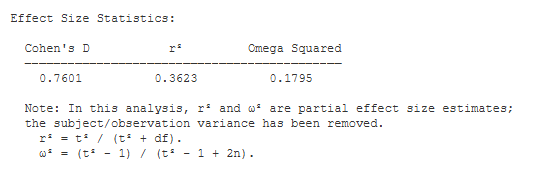
Effect Size Statistics
- Cohen’s d (-0.76): Cohen’s D is an effect-size estimate. It is equal to the mean of the difference scores divided by the standard deviation of the difference scores. It standardizes the mean difference in terms of standard deviation units.
- r² (.39): r² is an effect-size estimate. It represents the proportion of variance in the scores that can be accounted for by the treatment. Note that this is a partial effect size estimate — it does not take into account the variance due to subjects. Partial r² is equal to t² / (t² + df).
- Omega² (.20). Omega Squared is similar to r², in that it estimates the proportion of variance accounted for. However, it represents an unbiased estimate of variance accounted for — it accounts for sample size. Note that this is also a partial effect size estimate — it does not take into account the variance due to subjects. Partial Omega² is equal to (t² – 1.0) / (t² – 1.0 + 2n)
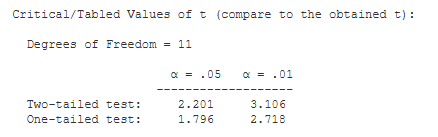
Critical Values. These are the values from a statistical table of critical values for the t test. In our case, we are conducting a two-tailed test with alpha = .05. So, we would compare the absolute value of our obtained t (2.63) to 2.201.
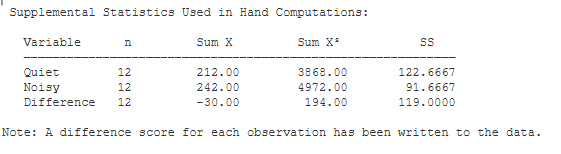 Supplemental Statistics Used in Hand Calculations. These are statistics that can be helpful if you would like to double check your hand-written computations.
See Hand-Written Work
Return to Table of Contents