Your homework problem:
You are interested in the effects of arousal on motor performance. A random sample of subjects perform a complex motor task under 3 conditions: no caffeine (low arousal), a small dose of caffeine (moderate arousal), and a large dose of caffeine (high arousal).
The dependent variable represents performance level: higher scores represent better performance.
This study resulted in the following data:
| Subject | Low Difficulty |
Moderate Difficulty |
High Difficulty |
| 1 | 15 | 17 | 19 |
| 2 | 2 | 7 | 4 |
| 3 | 11 | 12 | 6 |
| 4 | 13 | 15 | 5 |
| 5 | 12 | 12 | 7 |
| 6 | 2 | 18 | 11 |
| 7 | 8 | 12 | 5 |
| 8 | 9 | 14 | 2 |
Did the perceived level of caffeine significantly affect the participants’ performance (alpha = .05)? If your analysis reveals a significant overall effect, then make sure to explore all possible mean differences with a post-hoc analysis (same alpha).
Note that these are the same data that we worked with when you were working with the one-factor ANOVA for repeated-measures designs. This will allow you to compare and contrast the results of the two procedures.
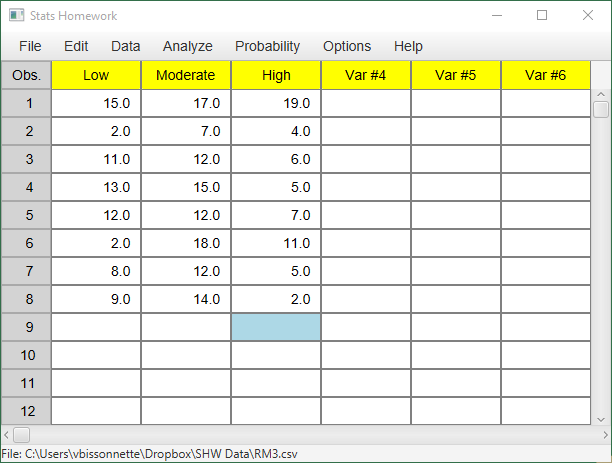
Enter these data into Stats Homework’s data manager and rename the variables. Your screen should look like this:
Make sure to double-check and save your data. To conduct your analysis, pull down the Analyze menu, choose Non-Parametric Tests, and then choose Friedman’s Test. You will be presented with a dialog that asks you to specify your variables:
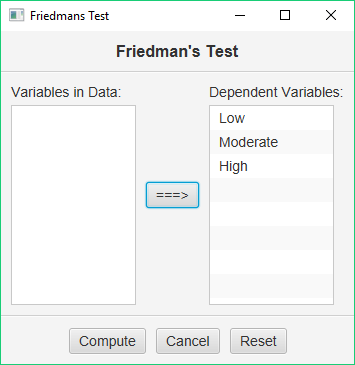
Add your three variables to the window on the right. When you are ready, click the Compute button. Stats Homework will produce the following output:
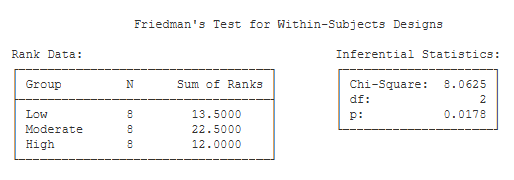
Rank Data. This table includes the number of scores for each group, and the sum of the ranks for each group.
Inferential Statistics. This table presents the Chi Square approximation to estimating the significance level of Friedman’s test.
- Chi-Square (8.06): This is the value of χ². This procedure does not have the ability to compute the exact significance level of Friedman’s test, so we will use the χ² approximation. (Food for thought: the exact p for this test can now be computed with a permutation test that is now included in Stats Homework).
- df (2): This is the df for the χ² statistic (equal to k – 1).
- p (.018): This is the significance level of the χ² test.