Example homework problem:
Twelve people completed a difficult hand-eye coordination task twice: once in a quiet room, and once in the same room while loud rock-and-roll music was being played. The order in which subjects experienced these conditions was counterbalanced: half performed in the quiet environment first, half performed in the loud environment first.
The researcher measured the number of errors committed by the participant while performing. Thus, the lower the score, the better the performance. Here are the results:
| Participant: | 1 | 2 | 3 | 4 | 5 | 6 | 7 | 8 | 9 | 10 | 11 | 12 |
| Quiet Environment: | 14 | 21 | 24 | 16 | 18 | 20 | 15 | 20 | 17 | 16 | 19 | 12 |
| Loud Environment: | 21 | 22 | 21 | 19 | 18 | 25 | 17 | 18 | 21 | 24 | 21 | 15 |
Was there a significant difference in performance between the two treatment conditions (alpha = .05)?
Note that these are the same data that we worked with when you were working with the dependent t test procedure. This will allow you to compare and contrast the results of the two procedures.
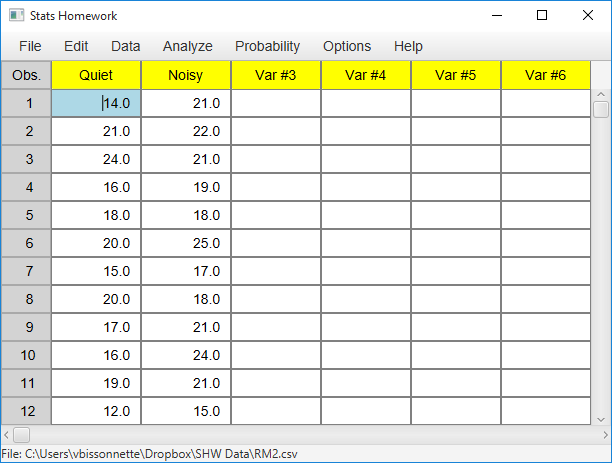
Enter these data into the first two columns of Stats Homework’s data manager and rename the variables. Your screen should look like this:
Make sure to double-check and save your data. To conduct your analysis, pull down the Analyze menu, choose Non-Parametric Tests, and then choose Wilcoxon Signed Ranks Test.
Before we look at the output produced by this procedure, let’s take a look at the variables that have been created by it and written back into your data:
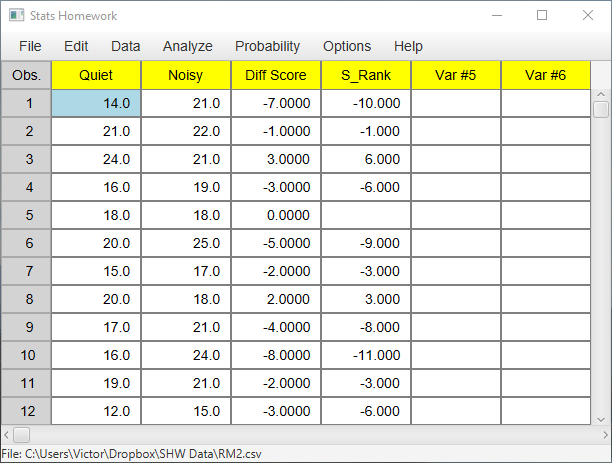
Note that Stats Homework has computed the difference between each pair of scores (Diff Score). It then ranked each of the non-zero differences from 1 to 11. Finally, it assigned a positive sign to the ranks of positive differences and a negative sign to the ranks of negative differences (S_Rank). These scores then are the signed ranks that are used in this test. Here is the output from the analysis:
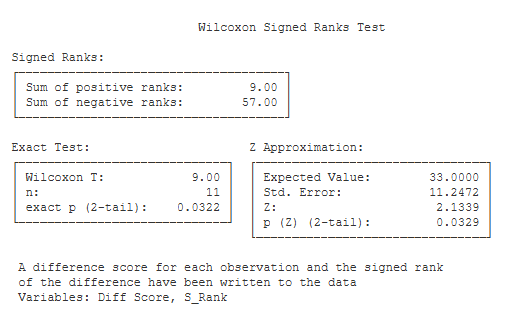
The first table presents the sums of the signed ranks: the sum of the positively-signed ranks and the sum of the negatively-signed ranks.
Exact Test. This table includes the test statistic and an exact test of their significance level.
- Wilcoxon T (9.00): Compare the sums of the signed ranks. The Wilcoxon T statistic is equal to the smaller of the two sums.
- n (11): This is the number of signed ranks that were used in this analysis.
- exact p (2-tail) (.032): This is the exact significance level of T if you are conducting a two-tailed / non-directional test.
- exact p (1-tail) (.016): This is the exact significance level of T if you are conducting a one-tailed / directional test.
Z Approximation. This table presents the normal-approximation approach to estimating the significance level of the signed-ranks test.
- Expected Value (33): If you are computing the Z approximation, this is the expected value of the signed ranks under your null hypothesis.
- Std. Error (11.25): This is the standard error of the Z statistic.Z (2.13): This is the value of the Z score for your test.
- p (Z) (2-tail) (.033): This is the significance level of the Z approximation if you are conducing a two-tailed / non-directional test.
- p (Z) (1-tail) (.016): This is the significance level of the Z approximation if you are conducing a one-tailed / directional test.