Your homework problem:
You are interested in the relationship between one’s perception of how difficult a task is and one’s actual performance on that task. You have conducted an experiment with 24 participants who each performed an identical spatial-ability task. Each participant was randomly assigned to one of four treatment groups: six participants were led to believe that the task was of low difficulty, six were led to believe that the task was of moderate difficulty, six were led to believe that the task was of high difficulty, and six were told nothing about the difficulty of the task. Scores could range from 0 to 10, with higher scores indicating better performance on the task.
This study resulted in the following data:
| Low Difficulty |
Moderate Difficulty |
High Difficulty |
No Information |
| 6 | 8 | 4 | 4 |
| 7 | 7 | 1 | 5 |
| 4 | 5 | 2 | 5 |
| 5 | 8 | 4 | 6 |
| 4 | 9 | 6 | 8 |
| 6 | 7 | 3 | 6 |
Did the perceived level of task difficulty significantly affect the participants’ performance (alpha = .05)? If your analysis reveals a significant overall effect, then make sure to explore all possible mean differences with a post-hoc analysis (same alpha).
If you would like some help with your hand-written work, click here.
Managing Data
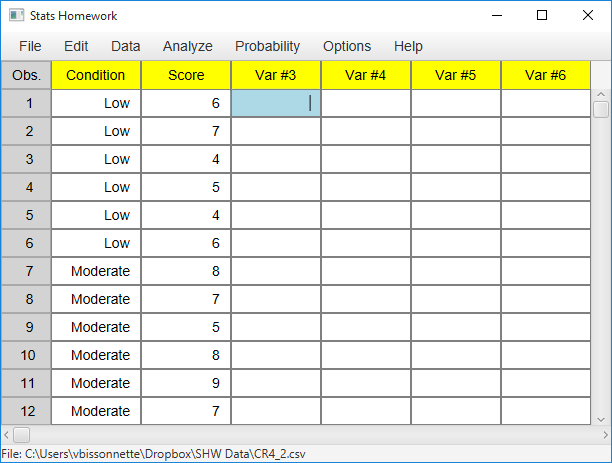
Create two variables in the data manager: one variable that contains the scores/data from all four groups, and a second variable that indicates which scores go with which group. You can create a numeric or non-numeric indicator variable. Your screen should look something like this:
Here is how the user dialog for the ANOVA will look:
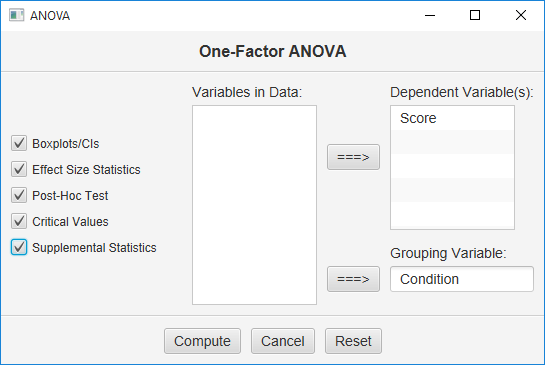
Move your data variable under “Dependent Variable,” and your indicator variable under “Grouping Variable.” Click all the output Options and then click the Compute button.
Basic Output
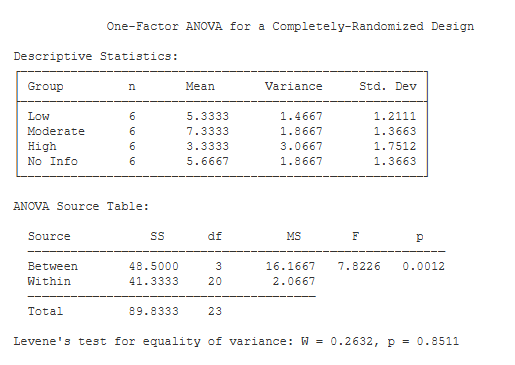
Descriptive Statistics. This table includes basic descriptive statistics for each treatment group.
ANOVA Source Table. This table details the result of your analysis of variance (ANOVA). You have two sources of variance: between-groups variance and within-groups variance. Each variance component is associated with its own sum of squares (SS), degrees of freedom (df), and mean square (MS).
F is equal to MS(Between) / MS(Within) (7.82). Next to the F statistic is p — the chance probability / significance level of your result (.001).
Levene’s Test. One of the assumptions of your F test is that the treatment groups have equal variance. Levene’s W provides a formal test of this assumption. If the p value of W is less than .05, you would be concerned that your groups have unequal variance.
Optional Outputs
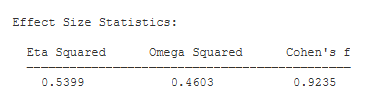
Effect Size. Eta Squared and Omega Squared describe the proportion of variance in your scores that can be attributed to your treatment effect. Omega Squared is an unbiased estimate of variance accounted for — i.e., it compensates for sample size.
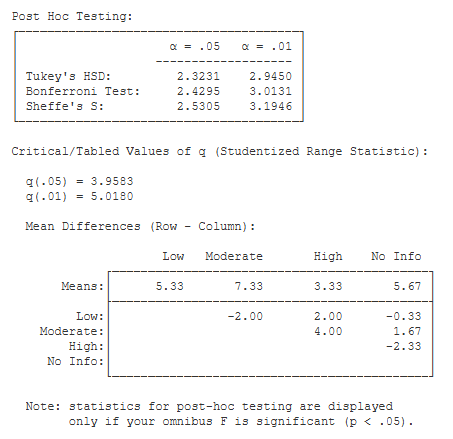
Post Hoc Testing. If you request post-hoc testing, Stats Homework will produce this output if your omnibus F statistic is significant:
You are presented with the critical value of Tukey’s Honestly Significant Difference (HSD) the Bonferroni test, and the Sheffe test. Below this table is a table of mean differences. To conduct a post-hoc test, you would compare the critical value of the test to each of the mean differences. If an obtained mean difference is greater than the critical value of the test being applied, then you would conclude that this mean difference is significant.
Also included in this output is the critical values of the Studentized Range Statistic (q), which is used to compute HSD.
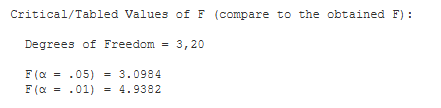
Critical Values. These are the values from a statistical table of critical values for the F test. In our case, we are conducting a test with alpha = .05. So, we would compare the value of our obtained F (7.82) to 3.098.
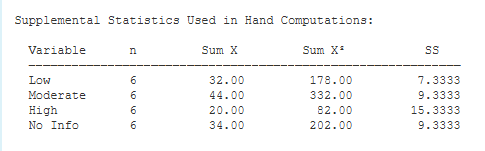
Supplemental Statistics Used in Hand Calculations. These are statistics that can be helpful if you would like to double check your hand-written computations.
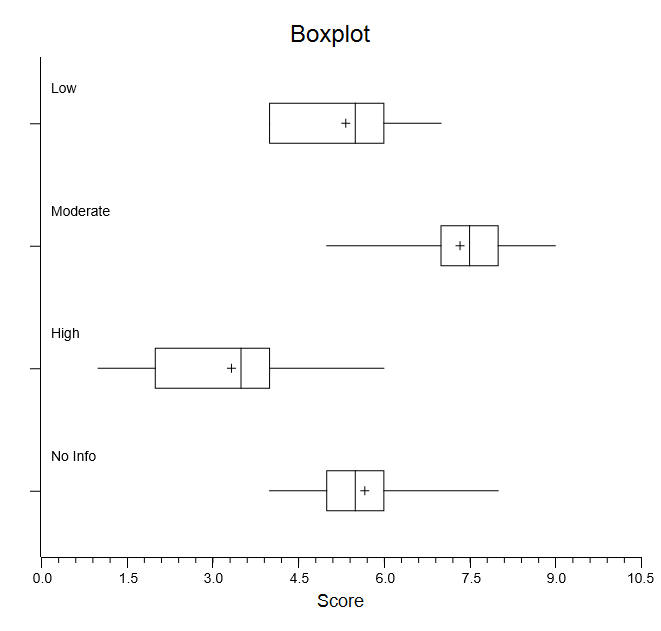 Box Plots. These graphical box plots can make it easier to interpret your results. You can also convert these plots to graphical confidence intervals and change a variety of things about them.