Homework Problem #1
You are working with the standard normal distribution (i.e., a distribution of z scores). What proportion of the scores in this distribution would be greater than a score of +0.50?
In Stats Homework, pull down the Probability menu, choose Illustrate Areas in a Distribution, and then choose Illustrate Areas in the Normal Distribution (if running the stand alone program, you will not need to do this). Here is the user dialog you will be working with:
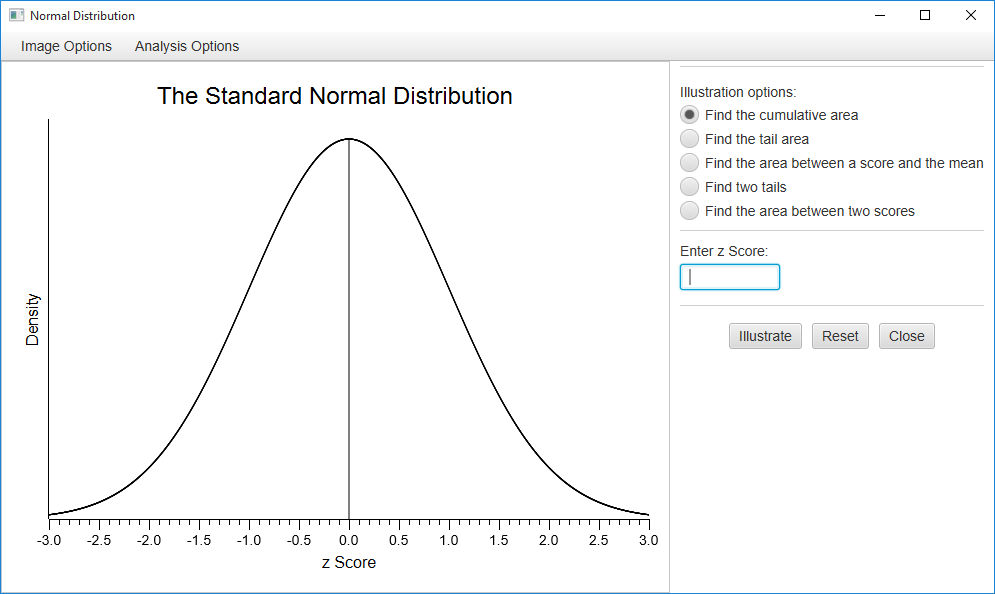
Click “Find the tail area,” enter a score of .50, and press the enter key or click on the “Illustrate” button. Here are the results:
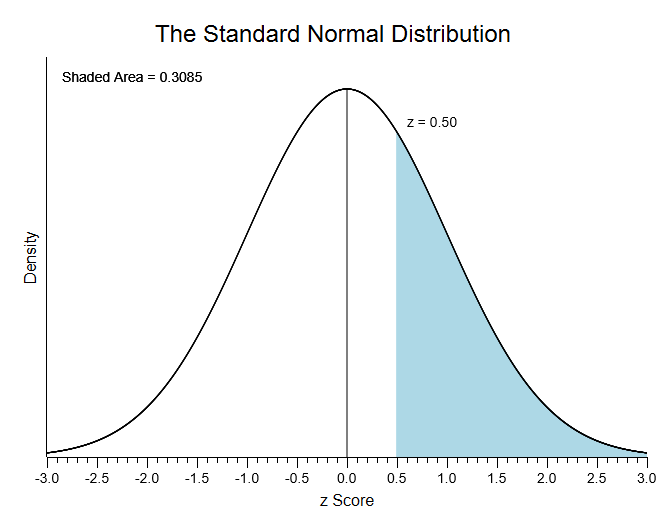
You can see that the area greater than a z score of .50 is equal to .3085. Now, click the other options to see what results you will get. Also, explore the Image Options. You can resize this plot, change the title or labels, copy it to your clipboard, and save it to a file.
Homework Problem #2
Which two z scores will define the central 95% of a standard normal distribution?
Pull down the Analysis Options menu, and choose Find Scores in the Normal Distribution. Click “Find scores for the central proportion,” enter .95 as your score, and then press enter or click the illustrate button. Here are the results:
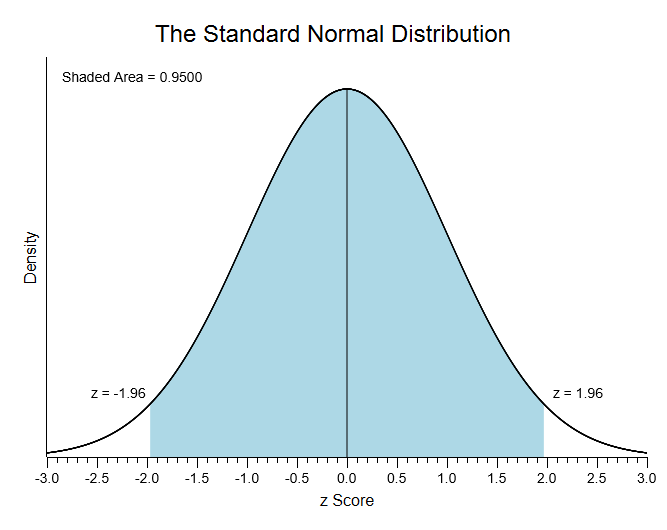
You can see that z scores of -1.96 and +1.96 define the central 95% of a standard normal distribution. Now, click the other options here to see the other types of results that you can produce.
Homework Problem #3
You are working with a normal distribution of IQ scores, which have a mean of 100 and a standard deviation of 15. What percentage of scores will be found between a score of 115 and a score of 130?
Press the “Reset” button. Now, pull down the Analysis Options menu, and choose Some other Normal Distribution. Also, click the “Find the area between two scores” option. You will have to enter four values:
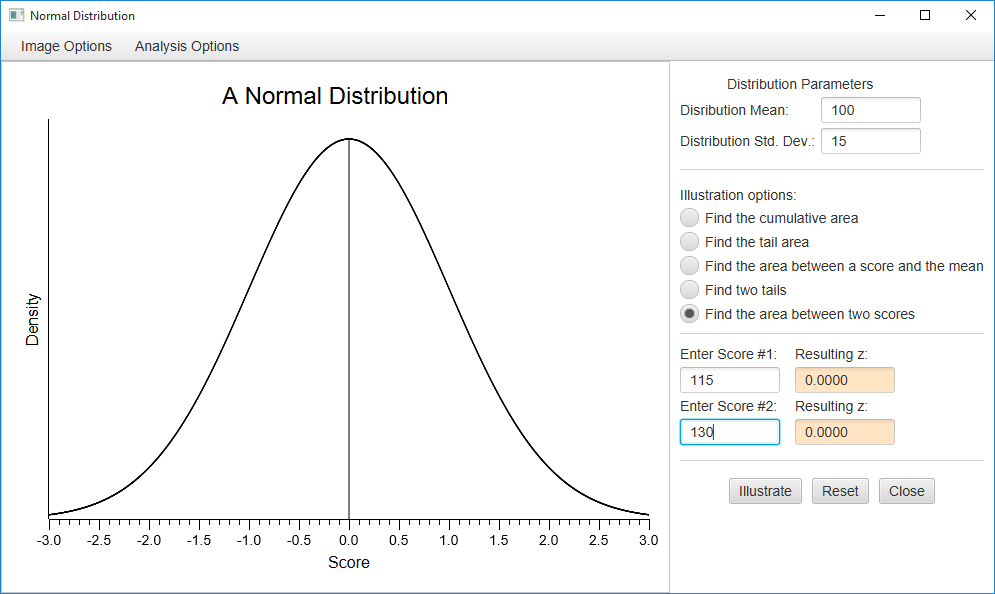
Enter a mean of 100, and a standard deviation of 15. Then, enter your two scores — enter 115 for the first one and 130 for the second (note that you must enter the lower score as your first score). Now, press enter or click “illustrate.” Here are the results.
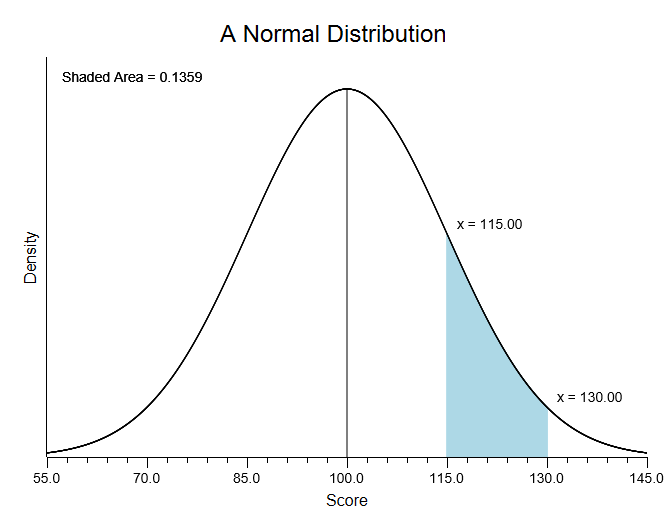
You can see that this area is equal to .1359. Notice that the program will fill in the z scores that you have to compute to solve this problem,