Your homework problem:
You are interested in the relationship between one’s perception of how difficult a task is and one’s actual performance on that task. You have conducted an experiment with 24 participants who each performed an identical spatial-ability task. Each participant was randomly assigned to one of four treatment groups: six participants were led to believe that the task was of low difficulty, six were led to believe that the task was of moderate difficulty, six were led to believe that the task was of high difficulty, and six were told nothing about the difficulty of the task. Scores could range from 0 to 10, with higher scores indicating better performance on the task.
This study resulted in the following data:
| Low Difficulty |
Moderate Difficulty |
High Difficulty |
No Information |
| 6 | 8 | 4 | 4 |
| 7 | 7 | 1 | 5 |
| 4 | 5 | 2 | 5 |
| 5 | 8 | 4 | 6 |
| 4 | 9 | 6 | 8 |
| 6 | 7 | 3 | 6 |
Did the perceived level of task difficulty significantly affect the participants’ performance (alpha = .05)? If your analysis reveals a significant overall effect, then make sure to explore all possible mean differences with a post-hoc analysis (same alpha).
Note that these are the same data that we worked with when you were working with the one-factor ANOVA. This will allow you to compare and contrast the results of the two procedures.
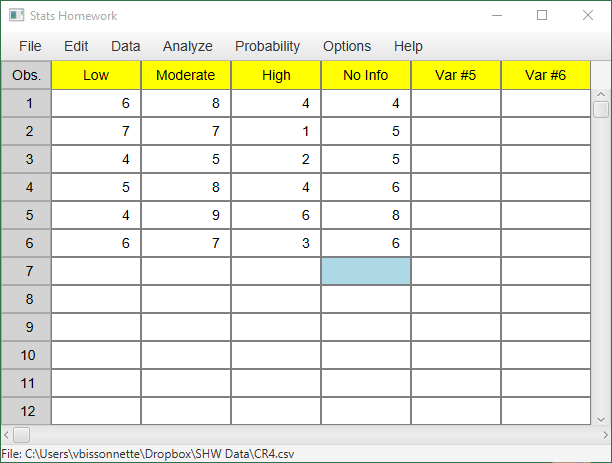
Enter these data into Stats Homework’s data manager and rename the variables. You may use a separate variable approach or an indicator variable approach. If you enter separate variables, your screen should look like this:
Make sure to double-check and save your data. To conduct your analysis, pull down the Analyze menu, choose Non-Parametric Tests, and then choose Kruskal-Wallace Test. You will be presented with a dialog that asks you to specify the design of your study:
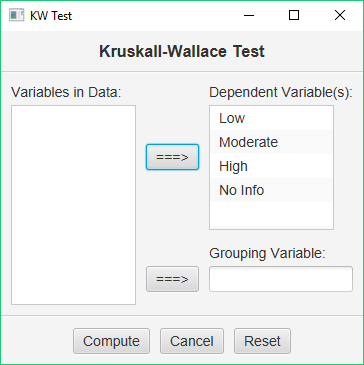
Add your four variables/groups to the design window on the right. When you are ready, click the ‘Ready’ button. Here is the output produced:
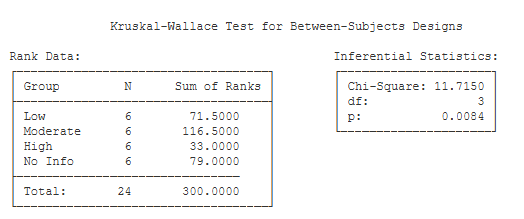
Rank Data. This table includes the number of scores for each group, and the sum of the ranks for each group.
Inferential Statistics. This table presents the Chi Square approximation to estimating the significance level of the Kruskal-Wallace test.
- Chi-Square (11.72): This is the value of χ². Stats Homework does not have the ability to compute the exact significance level of the K-W test, so we will use the χ²
approximation. - df (3): This is the df for the χ² statistic.
- p (.008): This is the significance level of the χ² test.