Example homework problem:
You work for an automotive magazine, and you are investigating the relationship between a car’s gas mileage (in miles-per-gallon) and the amount of horsepower produced by a car’s engine. You collect the following data:
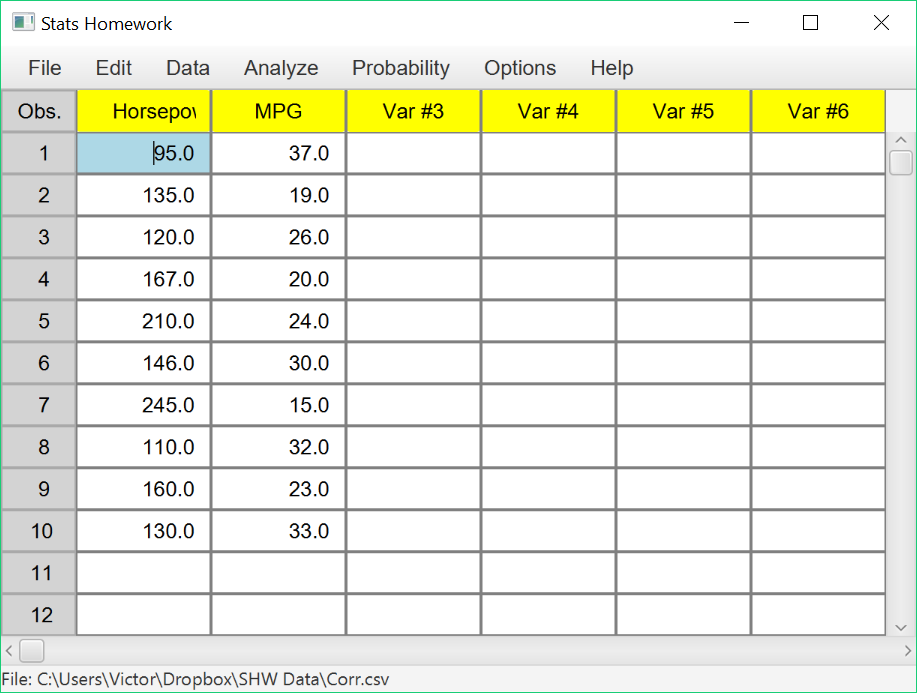
| Automobile: | 1 | 2 | 3 | 4 | 5 | 6 | 7 | 8 | 9 | 10 |
| Horsepower: | 95 | 135 | 120 | 167 | 210 | 146 | 245 | 110 | 160 | 130 |
| MPG: | 37 | 19 | 26 | 20 | 24 | 30 | 15 | 32 | 23 | 33 |
Is there a significant correlation between horsepower and MPG (alpha = .05)?
If you would like some help with the hand-written solution to this problem, then click here.
Enter these data into the first two columns of Stats Homework’s data manager and rename the variables. Your screen should look like this:
Make sure to double-check and save your data. To conduct your analysis, pull down the Analyze menu, choose Analysis of Relationship, and then choose Pearson Correlation. You will be presented with a dialog that will prompt you to choose the variables for this
analysis.
Select Horsepower and MPG. Also, check all the options on the left so that you can see all the output that is available:
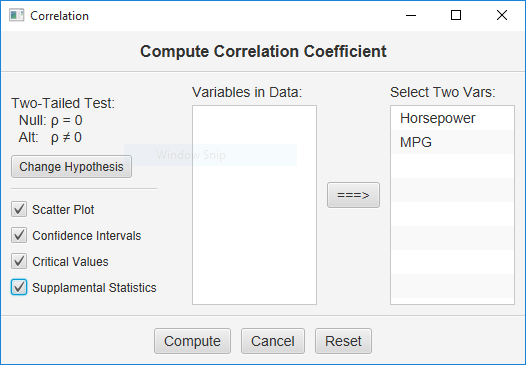
When you have selected your variables and options, click the “Compute” button.
Basic Output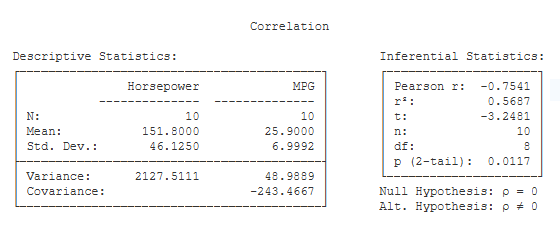 Descriptive Statistics. Basic descriptive statistics are covered on the page for the explore procedure. This table also includes:
- Covariance (-243.47): This is the covariance between X and Y (see hand-written work).
Inferential Statistics:
- Pearson r: (-0.75): this is your test statistic — the Pearson Product Moment Correlation Coefficient.
- r² (.57): this is the Coefficient of Determination. r² represents the proportion of variance in the two variables that is shared — i.e., the proportion of variance in Y that can be accounted for by X.
- t (-3.25): this is the value of the t test statistic that can be used to test the significance of r.
- n (10): this is the number of observations — i.e., the number of pairs of scores.
- df (8): this is the df of r and the df of the t test. df is equal to the number of pairs of scores minus 2.
- p (2-tail) (.01): this is the chance probability / significance level of r if you are conducting a two-tailed or non-directional hypothesis test.
Optional Output
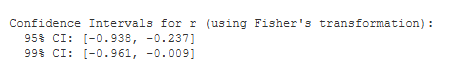
Confidence Intervals. You are given the 95% and 99% confidence intervals for the population correlation (rho), based on your sample r. The 95% confidence interval tells you that, with 95% certainty, you would estimate the population correlation to be between -.94 and -.24.
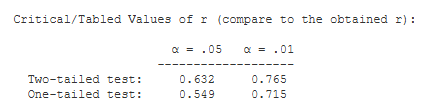
Critical Values. These are the values from a statistical table of critical values for r.
In our case, we are conducting a two-tailed test with alpha = .05. So, we would compare the absolute value of our obtained r (.75) to .632.
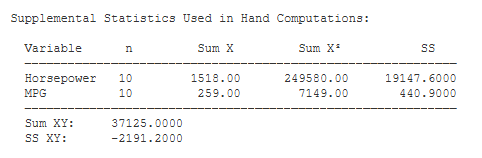
Supplemental Statistics Used in Hand Calculations. These are statistics that can be helpful if you would like to double check your hand-written computations.
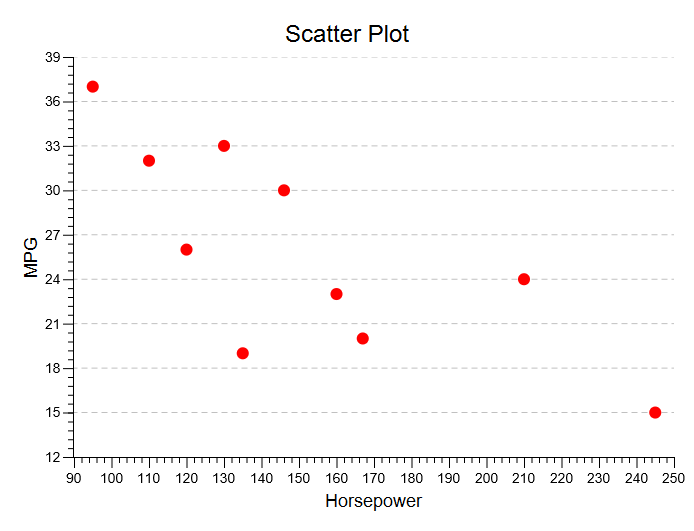
Scatter Plot. Finally, Stats Homework now produces a graphical scatter plot of your data. Make sure to explore the options you have here — e.g., you can change the titles and labels, add a regression line, reverse X and Y, and resize the plot to any dimensions that you would like.