Your homework problem:
You are interested in the effects of arousal on motor performance. A random sample of subjects perform a complex motor task under 3 conditions: no caffeine (low arousal), a small dose of caffeine (moderate arousal), and a large dose of caffeine (high arousal). The dependent variable represents performance level: higher scores represent better performance.
This study resulted in the following data:
| Subject | Low Difficulty |
Moderate Difficulty |
High Difficulty |
| 1 | 15 | 17 | 19 |
| 2 | 2 | 7 | 4 |
| 3 | 11 | 12 | 6 |
| 4 | 13 | 15 | 5 |
| 5 | 12 | 12 | 7 |
| 6 | 2 | 18 | 11 |
| 7 | 8 | 12 | 5 |
| 8 | 9 | 14 | 2 |
Did the perceived level of caffeine significantly affect the participants’ performance (alpha = .05)? If your analysis reveals a significant overall effect, then make sure to explore all possible mean differences with a post-hoc analysis (same alpha).
If you would like some help with your hand-written work, click here.
Enter these data into Stats Homework’s data manager and rename the variables. Your screen should look like this:
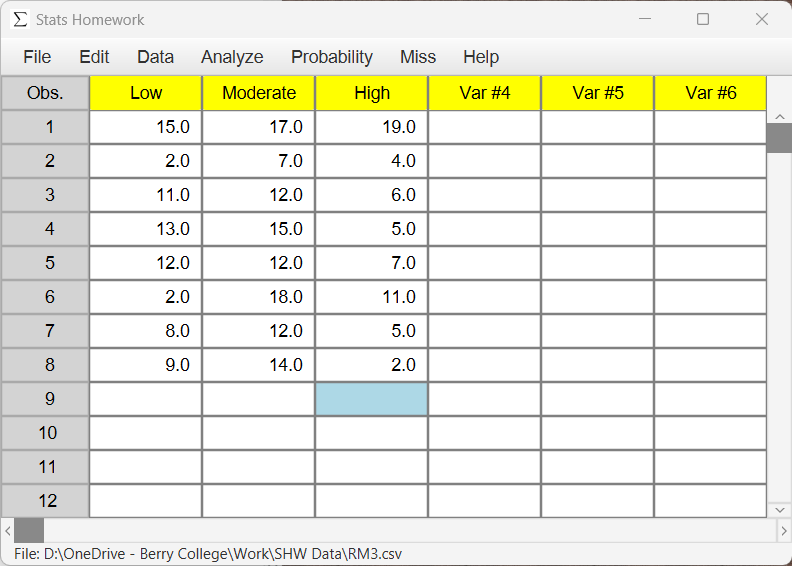
Make sure to double-check and save your data. To conduct your analysis, pull down the Analyze menu, choose Analysis of Variance, and then choose One-Factor ANOVA for Repeated-Measures Designs. You will be presented with this user dialog:
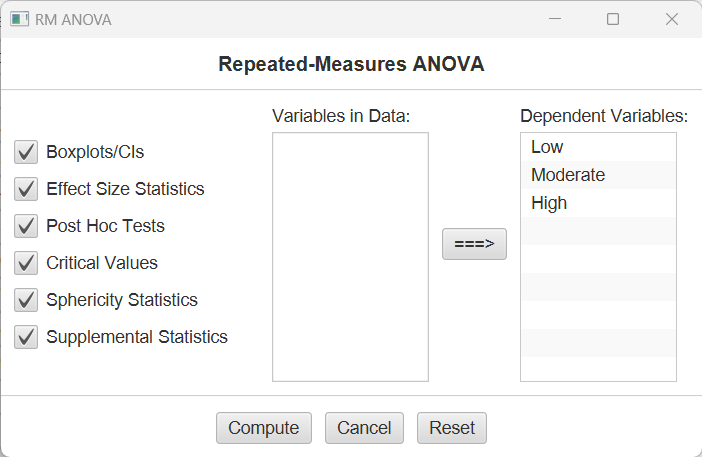
Move your three variables under “Dependent Variables,” select all the output options, and press the Compute button.
Basic Output
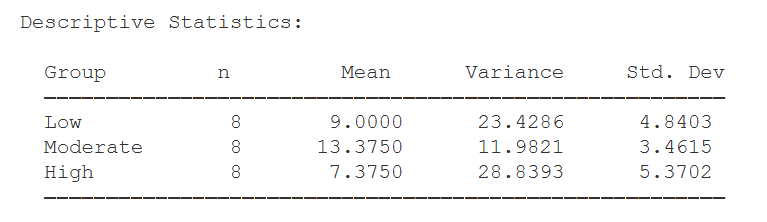
Descriptive Statistics. This table includes descriptive statistics for each treatment condition.
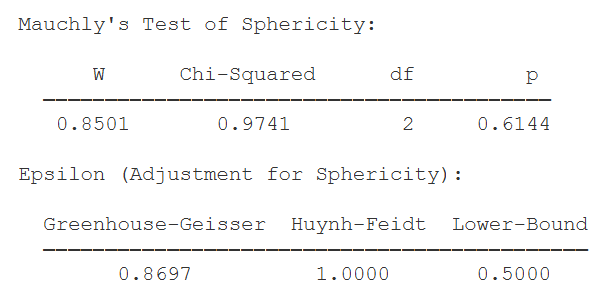
Mauchly’s Test for Sphericity. If you request it, this table presents the results of Mauchly’s test – whether your data depart from the assumption of sphericity. If the Chi-Squared test is significant here, you should be cautious about interpreting the p-value associated with the F test in the ANOVA. If this test is significant, you might be interested in adjusting the df in your analysis with one of the adjustments provided.
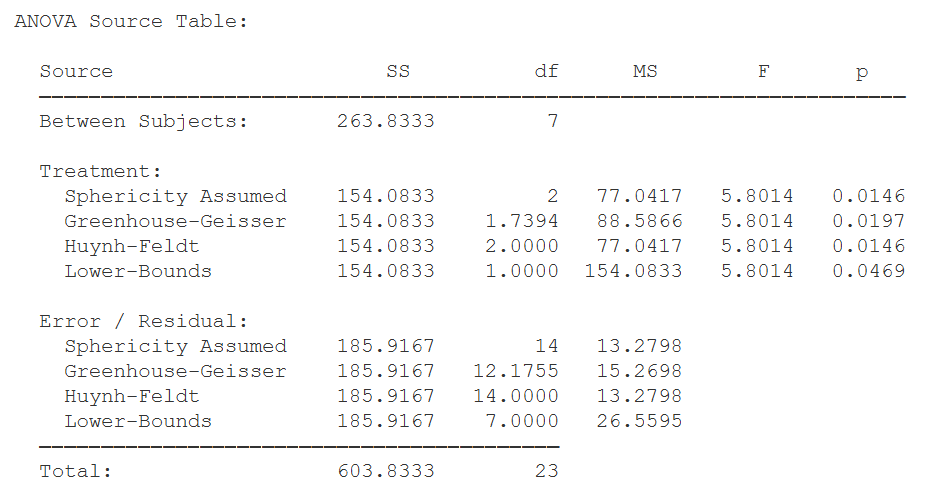
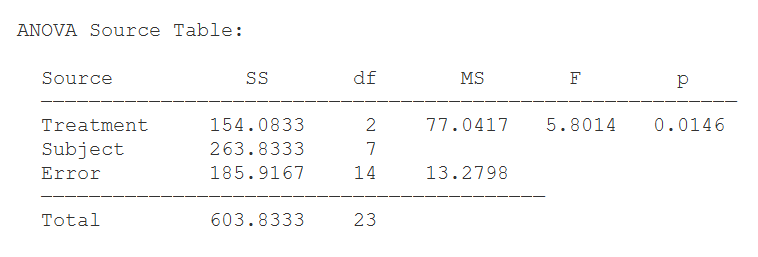
ANOVA Source Table. This table details the result of your analysis of variance (ANOVA). You have three sources of variance: treatment condition variance, subject variance, and error variance. Each variance component is associated with its own sum of squares (SS), degrees of freedom (df), and mean square (MS). When you select the option for sphericity statistics, you will also be provided with all of the adjusted results in this table.
The F statistic is equal to MS(Treatment) / MS(Error) (5.80). Next to the F statistic is p — the chance probability / significance level of your result (.015). Again, this would be the F statistic and p value that we would interpret if your data demonstrate sphericity. If you do not request the sphericity statistics, you will be presented with a simplified ANOVA Source Table:
Optional Outputs
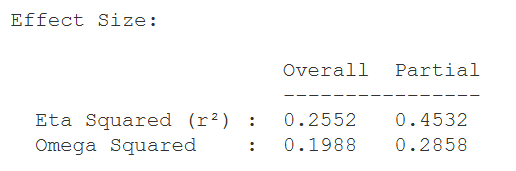
Effect Size. Eta Squared and Omega Squared describe the proportion of variance in your scores that can be attributed to your treatment effect. Omega Squared is an unbiased estimate of variance accounted for — i.e., it compensates for sample size.
This table displays the overall effect sizes — these give you the proportion of the total variance accounted for. In addition, it displays the partial effect sizes — these give you the proportion of variance accounted for after you have removed the subject variance.
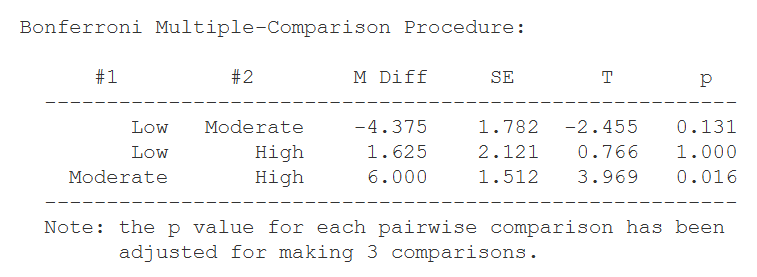
Post-Hoc Testing. If you request it, Stats Homework will also produce this output if your overall F statistic is significant and you have more than two groups. You are presented with the results of all pair-wise comparisons, where each test has been adjusted with the Bonferroni correction (basically, you multiply the p value for each test by the number of tests).
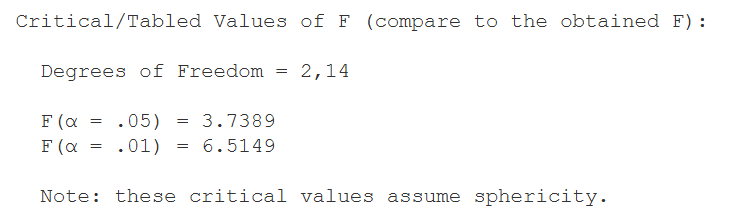
Critical Values. These are the values from a statistical table of critical values for the F test. In our case, we are conducting a test with alpha = .05. So, we would compare the value of our obtained F (7.82) to 3.74. Again, using this F value as your critical value assumes sphericity.

Supplemental Statistics Used in Hand Calculations. These are statistics that can be helpful if you would like to double check your hand-written computations.
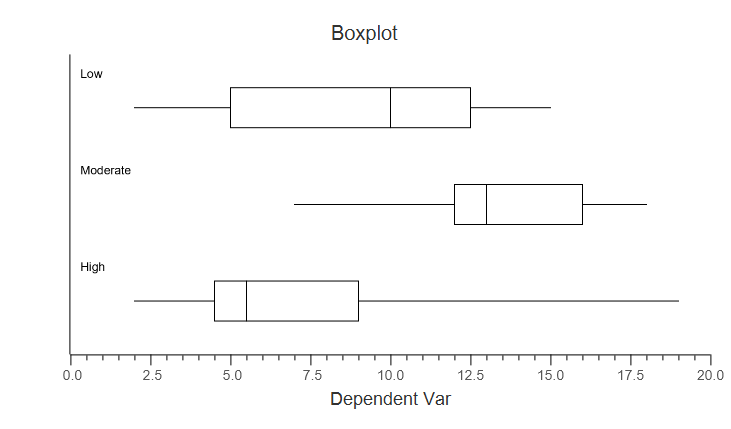
Box Plots. Finally, you will be presented with graphical box plots of your data. You can modify these plots in a variety of ways, save them to disk, or copy them to your clipboard.