Example homework problem:
You work for an automotive magazine, and you are investigating the relationship between a car’s gas mileage (in miles-per-gallon) and the amount of horsepower produced by a car’s engine. You collect the following data:
| Automobile: | 1 | 2 | 3 | 4 | 5 | 6 | 7 | 8 | 9 | 10 |
| Horsepower: | 95 | 135 | 120 | 167 | 210 | 146 | 245 | 110 | 160 | 130 |
| MPG: | 37 | 19 | 26 | 20 | 24 | 30 | 15 | 32 | 23 | 33 |
Is there a significant correlation between horsepower and MPG (alpha = .05)?
Note that these are the same data that we worked with when you were working with the Pearson correlation procedure. This will allow you to compare and contrast the results of the two procedures.
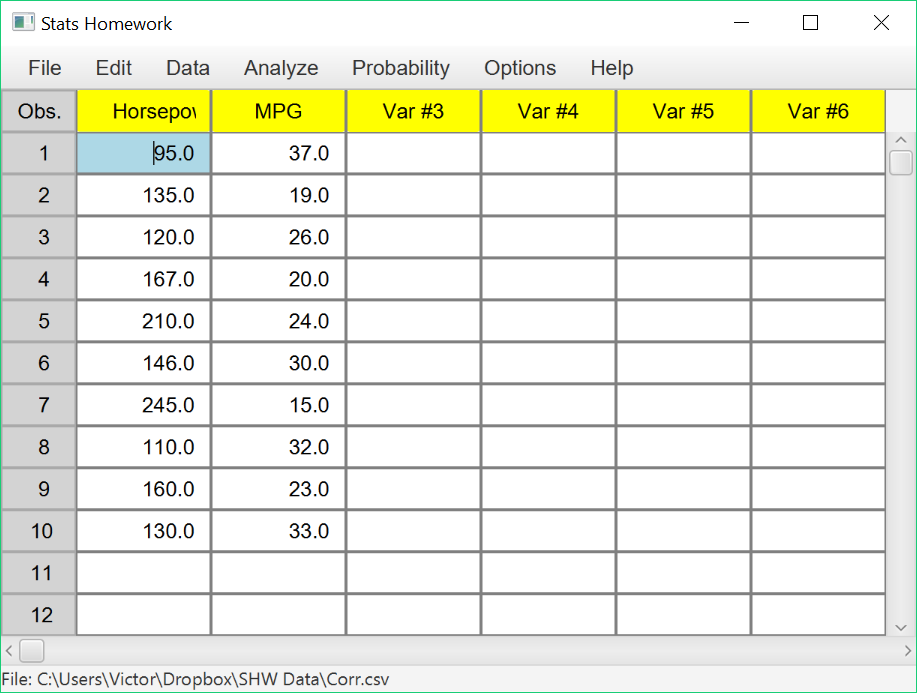
Enter these data into the first two columns of Stats Homework’s data manager and rename the variables. Your screen should look like this:
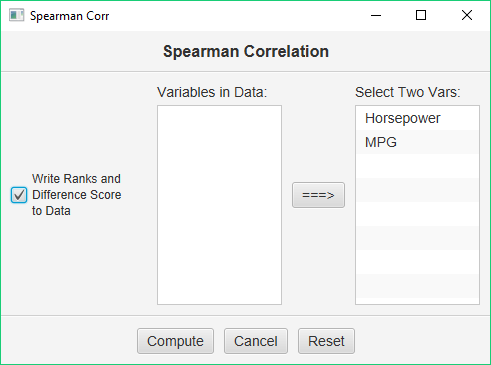
Make sure to double-check and save your data. To conduct your analysis, pull down the Analyze menu, choose Non-Parametric Tests, and then choose Spearman Correlation. You will be presented with this dialog:
Select horsepower and gas mileage as your variables. Check the option to output our difference scores to your data, and click Compute.
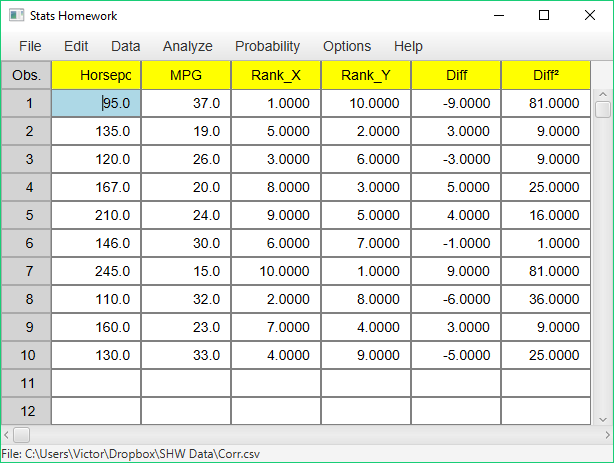
Before we look at the output produced by this procedure, let’s take a look at the variables that have been created by it and written back into your data:
Note that the Spearman procedure has ranked each of your variables and has put these ranks into two new variables, Rank_X and Rank_Y. Also, it has computed the difference between each pair of ranks (Diff), and the squares of these differences (Diff²).
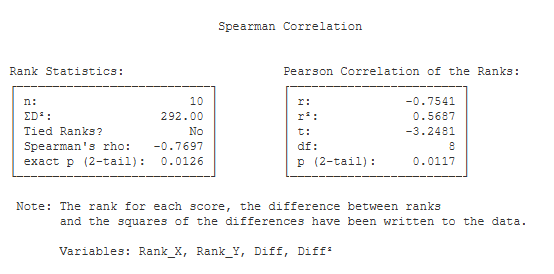
We use the sum of the squared differences (ΣD²) to compute the Spearman correlation. Now, the output will be easy to figure out:
Rank Statistics.
- n (10): this is the number of pairs of scores.
- ΣD² (292.00): this is the sum of the squared differences between the ranks of the scores.
- Tied Ranks? (No): this tells you whether or not the procedure found any ties in the ranks of the scores. This is an important consideration when computing the Spearman Correlation.
- Spearman’s rho (-.77): this is the value of the Spearman correlation.
- exact p (2-tail) (.011): this is the exact significance level of the Spearman correlation when you are conducting a two-tailed / non-directional test.
- exact p (1-tail) (.005): this is the exact significance level of the Spearman correlation when you are conducting a one-tailed / directional test.
Pearson Correlation of the ranks.
- r (-0.77): this is the Pearson correlation between the ranks of your scores.
- r² (.59): r² describes the effect size in terms of the proportion of variance accounted for in the ranks.
- t (-3.41): this is the value of the t test statistic that can be used to test the significance of r.
- df (8): this is the df of the t test. df is equal to the number of pairs of scores minus 2.
- p (2-tail) (.009): this is the significance level of t if you are conducting a two-tailed or non-directional hypothesis test.
- p (1-tail) (.005): this is the significance level of t if you are conducting a one-tailed or directional hypothesis test.


