The data manager
Stats Homework employs a simple spreadsheet-style data manager:

To enter data, simply enter data into a cell, and then move to another cell by pressing the enter key, the tab key, or one of the arrow keys. The data manager accepts numeric and non-numeric data. Notice that the first cell is in blue — this is the active cell that is ready to accept data.
Example. Enter the numbers 1 to 10 in the first column of the data manager. Next, click on the yellow column heading (currently “Var #1); this is how you change a variable name. You will be presented with this dialog:
Enter a new variable name for your variable, and click “Update Variable.” You should always label your data — so let’s get you in that habit right away!
Another thing that you should always do is to save your data. Pull down the File menu and choose Save Data As. Choose a file location and a file name. When you are done, your screen should look like this:
Notice that the file name you chose is now displayed at the bottom of the screen. Also note that the default format for the data files saved by Stats Homework is CSV (comma-separated values). It would be best if you add ‘.csv’ to the end of your file name. You can also save your data as tab-delimited data if you would like.
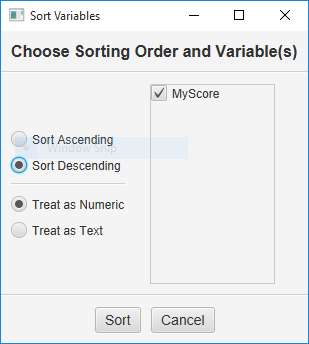
Let’s explore some of the data manipulation tools built into Stats Homework. Pull down the Data menu and choose Sort Variables:
Click once on your variable name, click Sort Descending, and then click the Sort button. Your data will now be ordered from 10 down to 1.
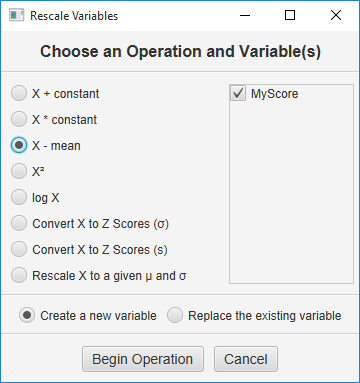
Now, pull down the Data menu and choose Rescale Data:
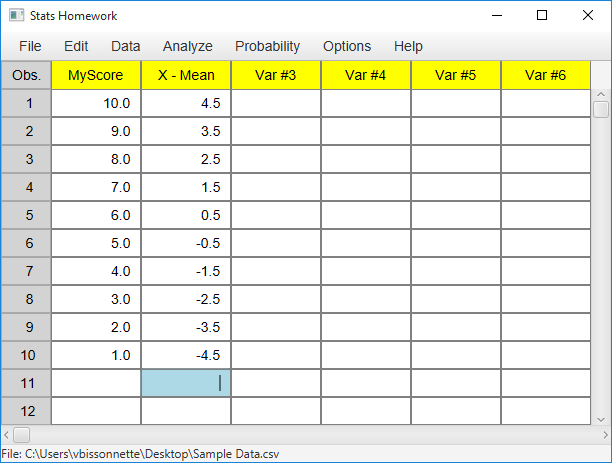
Click once on your variable name, click X – Mean, and then click the Begin button. Your screen should now look this this:
You just generated the deviations about the mean for your data. The mean for these data is 5.50. So, each score in the second column is equal to the score in the first column minus 5.50. Notice how the second column is automatically given a label. Just for practice, use the Rescale Data dialog to compute the square of each of these deviation scores.
Re-save your data and spend some time exploring the features of the data manager. You will find that it is very easy for you to use and that it has a variety of helpful functions built into it.
Pasting Data From Other Programs
If your data happen to already be entered into a spreadsheet such as Microsoft Excel, or Open Office, you can easily transfer the data from that program to Stats Homework. Simply highlight the data in your spread sheet and copy these data to the clipboard by pressing Ctrl-C. Then, pull down the Edit menu in Stats Homework, and select “Paste Data from Clipboard.” If this approach does not work well for you, use the file transfer procedure described next.
Importing Data Files from Other Programs
Stats Homework reads and writes CSV and tab-delimited files — the default format is CSV. A delimiter is a specific character that you use to separate data in your data file. In a CSV file there is a comma between each score within an observation (line), and then there is a carriage return (i.e. the enter key) at the end of each line.
The first line in the file should include the name(s) of the variable(s). Each line below the first contain the data. So a CSV data file will look something like this:
Variable_Name_#1,Variable_Name#2,Variable_Name_#3
score,score,score
score,score,score
score,score,score
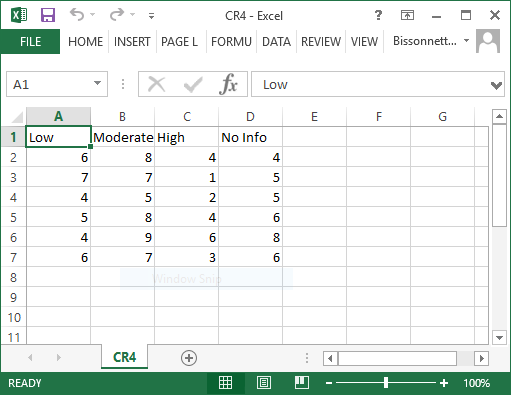
You can create CSV and tab-delimited files in a number of different programs. For example, spreadsheet programs like Microsoft Excel® are very powerful data managers. Let’s say that you have a data set in Excel that you would like to analyze with Stats Homework. Here are the data from the one-factor ANOVA problem:
Note that the variable names are in the first row of data, and the data follow — one column for each variable, one row for each observation.
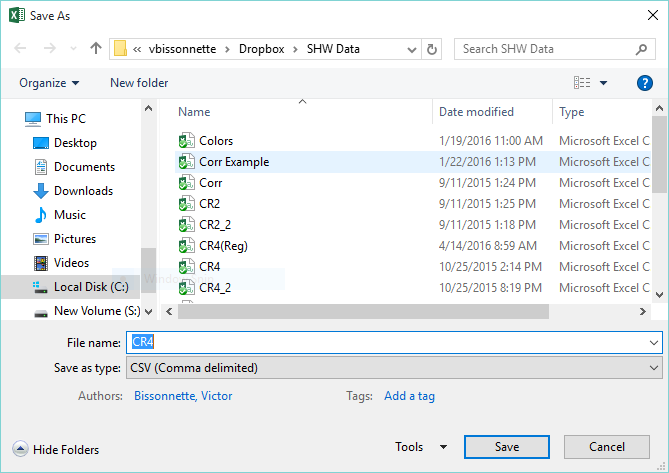
To export the data, pull down the File menu, and choose Save As. You will be presented with a dialog window:
Change the file type to CSV or to Text(Tab Delimited), then give your file a new file name, and then click the Save button. When saving CSV files, make sure to add ‘.csv’ to the end of your filename.
Generating Random/Simulated Data
Stats Homework includes a number of routines that can be used to generate random simulated data sets that you might use for a statistical analysis. Let’s work with one example to illustrate the function of these procedures.
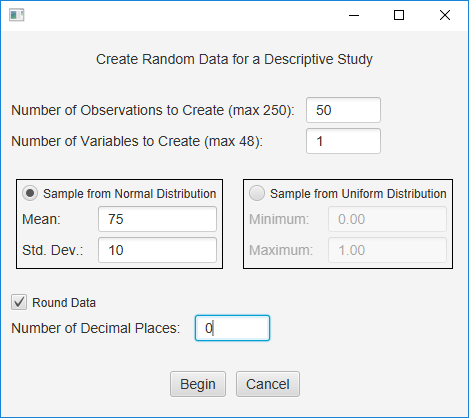
Pull down the Data menu, click Simulate Data, and then click Simulate Data for a Descriptive Study. You will be presented with this dialog window:
We will simulate a sample of exam scores similar to those that you might see on a typical college exam. Specify that you would like to create one variable with 50 observations. Specify that you would like the mean to be 75 with a standard deviation of 10. Specify that you would like to round the scores. When your dialog window looks like the one above, press the Begin button.
You will find that your data manager now has a new variable with 50 scores. Investigate these scores with the explore procedure, and create a histogram of these data. You will find that your scores will not have a mean and standard deviation of exactly 75 and 10, respectively, but they will tend to be quite close to this.
For practice, repeat this procedure and vary the sample size. You should notice that when you choose a larger n (e.g., over 100), your sample statistics will tend to be closer to the parameters that you specify.


