Example Homework Problem:
When polled about a proposition on an upcoming ballot, the responses of men and women were as follows:
| Agree | Undecided | Disagree | |
| Men: | 70 | 25 | 40 |
| Women: | 30 | 20 | 25 |
Do men and women differ in their attitudes towards this issue (alpha = .05)?
If you would like help with the hand-written work for this problem, click here.
In Stats Homework pull down the Analyze menu, choose Analysis of Frequency or Proportion, and then choose Contingency Table.
Manually Entering Frequency Data
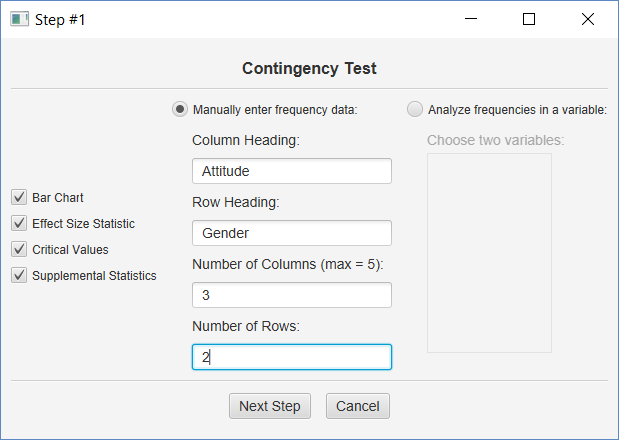
In the first dialog, enter the names of both variables, and the number of levels of each. Then click all the output options and click Next Step.
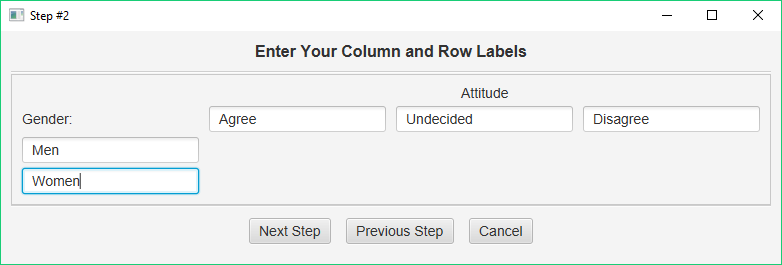
Next, you will enter the column and row headings. When finished, click Next Step.
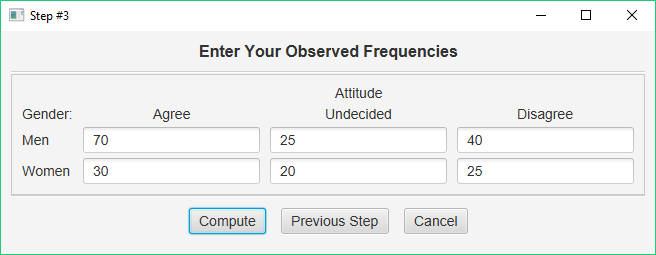
Finally, you will enter the frequencies for each cell in your contingency table. When finished, click the Compute button.
Basic Output
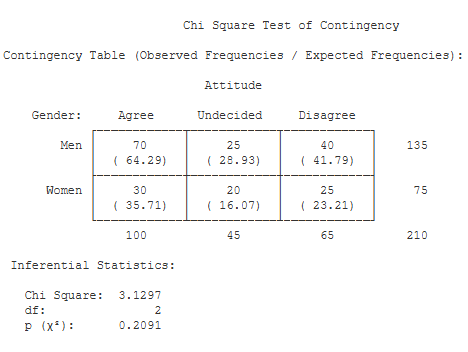
Contingency Table. This table summarizes all of the observed and expected frequencies, including the row and column totals.
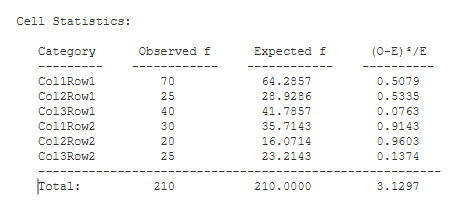
Cell Statistics. This table lists the observed and expected frequencies for each cell. In addition, this table presents each cell’s contribution to the Chi Square statistic, and the total Chi Square statistic.
Inferential Statistics. This table presents the Chi Square statistic (3.13), its df (2), and the p value for the obtained value of Chi Square (.21).
Optional Output
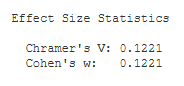
Effect Size Statistics. This table includes the effect size statistic, Cramer’s V (.12) and Cohen’s w (.12). If you analyze a 2 X 2 contingency table, the Phi coefficient will be displayed instead of Cramer’s V.
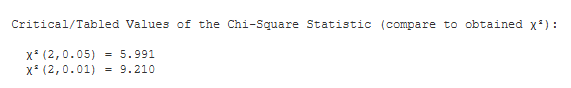
Critical Values. These are the values from a statistical table of critical values for the Chi Square test. In our case, we are conducting a test with alpha = .05. So, we would compare the value of our obtained Chi Square (3.13) to 5.991.
Supplemental Statistics. This table lists the contribution that each cell made toward the Chi-Squared statistic. This can be used to double-check your hand-written solution to this problem.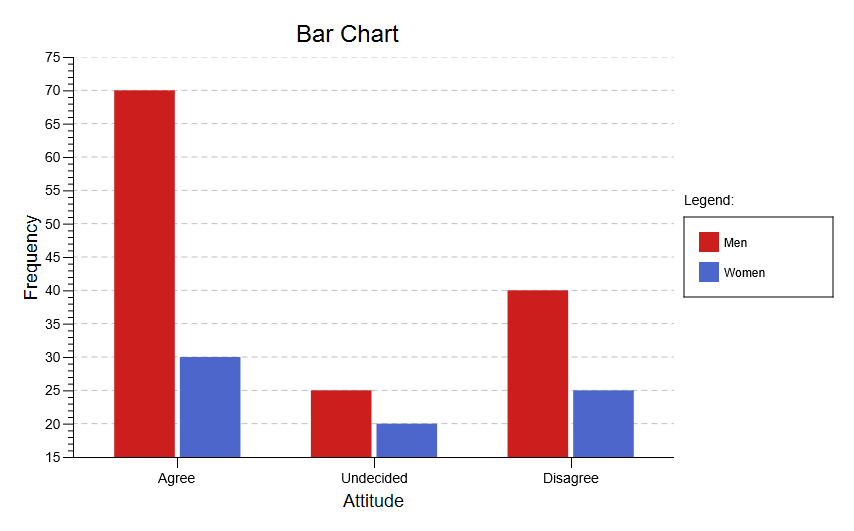
Bar Chart. This chart graphically illustrates the frequencies analyzed in the contingency test. It can display frequencies and relative frequencies, and it includes a number of options for reversing the variables and changing the appearance of the chart.