Example homework problem:
Twenty five high school students complete a preparation program for taking the SAT test. Here are the SAT scores from the 25 students who completed the SAT prep program:
434 694 457 534 720 400 484 478 610 641 425 636 454
514 563 370 499 640 501 625 612 471 598 509 531
The mean of these scores is 536.00. We know that the population average for SAT scores is 500 with a standard deviation of 100.
The question is, are these students’ SAT scores (M = 536) significantly greater than a population mean of 500 with a population standard deviation of 100? Note that the the maker of the SAT prep program claims that it will increase (and not decrease) your SAT score. So, you would be justified in conducting a one-directional test. (alpha = .05).
The goal of your analysis is to test for a significant deviation between your sample mean and the population mean. In the case, the population standard deviation is a known parameter.
So, we will test the mean of these data against the value 500 with a one-sample Z test of the mean:
 The numerator of the formula is equal to your sample mean minus the population value you are comparing your sample to. The denominator is equal to standard error: the standard deviation of the population divided by the square root of n (the number of scores in your sample). If you would like help computing the sample mean, please see the documentation for the explore procedure.
Compute test statistic. You will find that the sample mean is equal to 536.00. Now, compute your Z statistic:
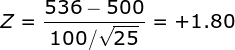 Conduct hypothesis test. Since the company promoting the SAT prep program specifically claims that the program will improve SAT scores, we will conduct a directional (i.e., one-tailed) test with alpha = .05. When you check a table of Z values, you will find that the critical value of Z is 1.65. Since your obtained value of Z (+1.80) was greater than 1.65, you would conclude that the prep program resulted in a significant improvement in SAT scores.